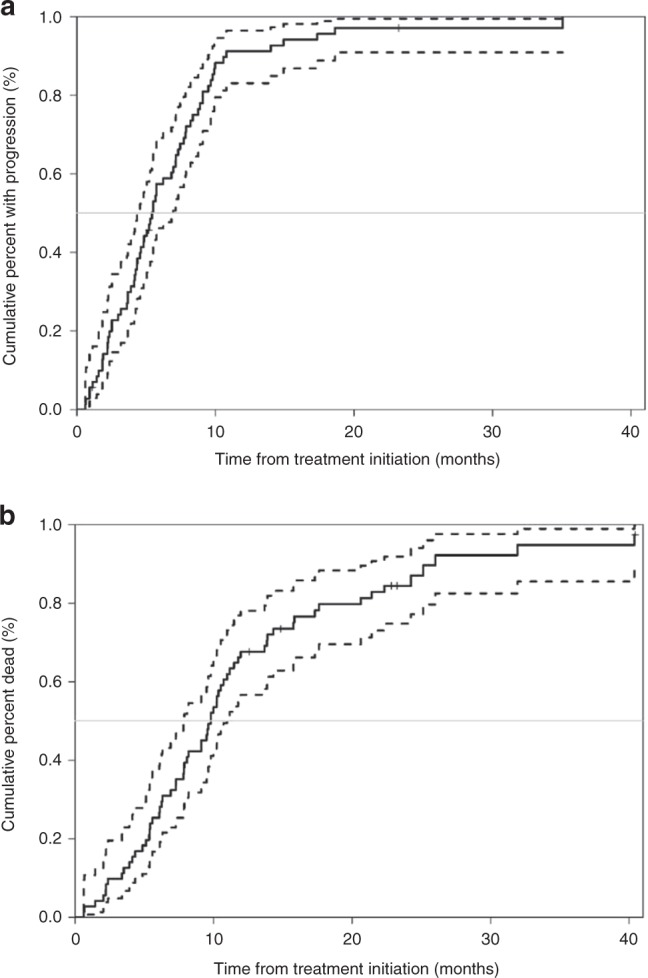
Fig. 1. Kaplan–Meier estimates of survival. The estimate is represented with a solid line and the 95% confidence interval is represented with dotted lines.

Kaplan–Meier estimates of (a) progression-free survival and (b) overall survival. The estimate is represented with a solid line and the 95% confidence interval is represented with dotted lines.
