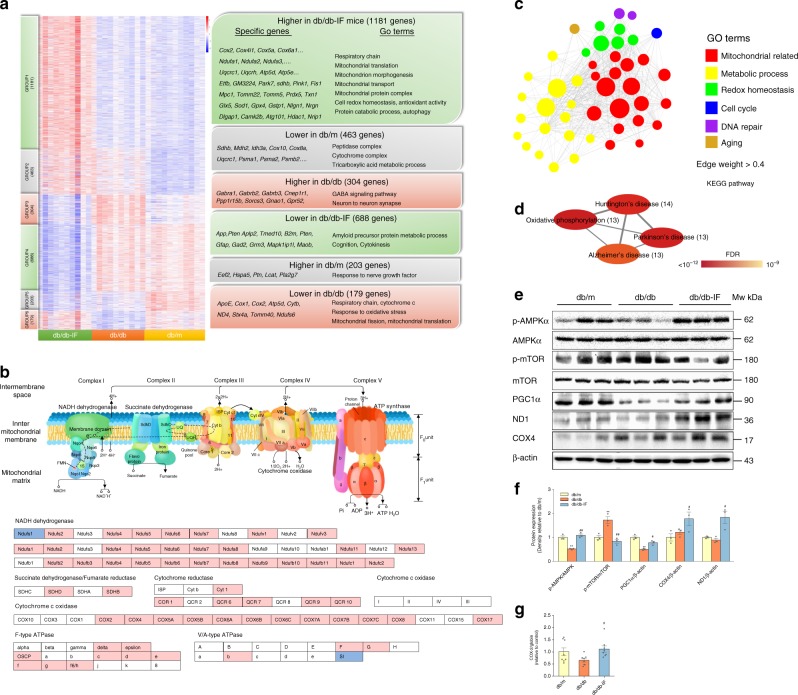
Fig. 3. Intermittent fasting improved energy metabolism and mitochondrial biogenesis in the hippocampus.
a Heatmap displaying 2503 differentially expressed genes in the hippocampus among db/m, db/db, and db/db-IF groups (n = 11, 9, 11 mice in each group, respectively) that were clustered into six distinct gene groups through DEG analysis using Ballgown software (FDR-p < 0.05). Enriched GO terms (FDR-p < 0.05) and representative genes are shown on the right for each cluster. The p-values of GO terms were determined on the WebGestalt website; b KEGG of oxidative phosphorylation (FDR-p < 0.05) of group 1 (1181) and group 4 (688) genes based on DEG analysis. Pink represents upregulation during Intermittent fasting. Blue represents downregulation during Intermittent fasting. c Network and GO annotation of 49 brown-module hub genes (upregulated when intermittent fasting, r[ME and gene] > 0.8, r[trait and gene] > 0.85, FDR-p < 0.01) in WGCNA analysis (edge weights > 0.4). The p-values of GO terms were determined on the WebGestalt website; d KEGG analysis (FDR-p < 0.05) of the brown-module hub genes in the WGCNA analysis. The p-values of KEGG analysis were determined on the WebGestalt website; e, f Western blots of mTOR/AMPK/PGC1α signaling (n = 3 mice per group); g mitochondrial DNA levels in brain tissue (n = 8 mice per group). Data of f, g presented as mean ± SEM. *p < 0.05, **p < 0.01, compared with the db/m group, #p < 0.05, ##p < 0.01 compared with the db/db group. Significant differences in d, g between mean values were determined by one-way ANOVA with Tukey’s multiple comparisons test. The boxplot elements are defined as following: center line, median; box limits, upper and lower quartiles; whiskers, 1.5 × interquartile range. See also Supplementary Fig. 3 and Supplementary Data 1–5. Source data are provided as a Source Data file.

