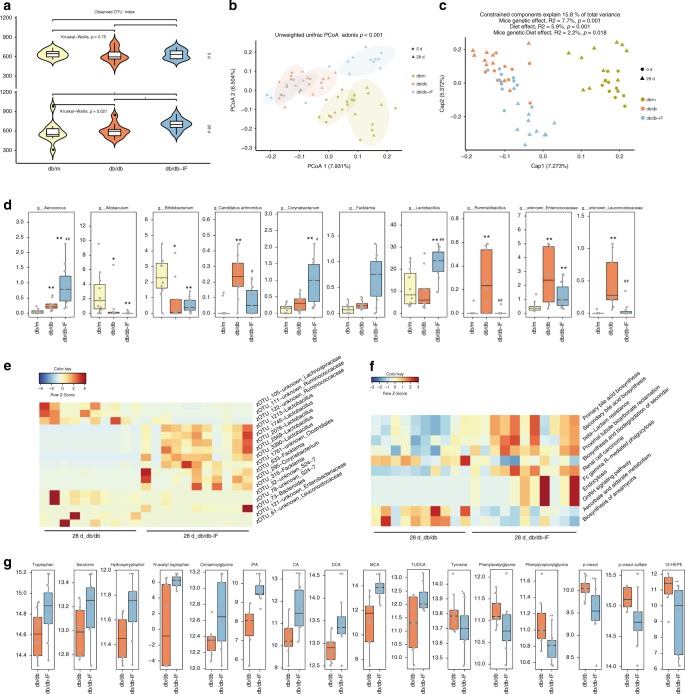
Fig. 4. Gut microbiome and plasma metabolome analysis of intermittent fasting-treated db/db mice.
a Total number of observed OTUs in db/m, db/db, and db/db-IF (n = 11, 10, 11 mice in each group, respectively). Significant differences between day 0 and day 28 were tested by Kruskal-Wallis test. Significant differences between treatment groups were tested by Wilcoxon rank-sum test (*p < 0.05). b Principal coordinate analysis (PCoA) based on unweighted Unifrac distance and permutational manova (adonis) were used to test the difference in gut microbiota composition and diversity between groups (the colored ellipse denotes an 80% confidence within each group. c Constrained analysis of principal coordinate (CAP) of diet and mice gene type was performed on cumulative sum scaling (CSS) normalized Bray Curtis distance after the removing time effect. The permutational ANOVA-like test for constrained respondence analysis (ANOVA.CCA) was applied to examine the influence of diet and mice gene type on the matrix. d Relative abundance of different genera was identified by an analysis of composition of microbiome (ANCOM) on day 28 (FDR-p < 0.05). Wilcoxon rank-sum test was adopted for comparisons between groups (*p < 0.05, **p < 0.01, compared with the db/dm group, #p < 0.05, ##p < 0.01 compared with the db/db group). e A Z-score scaled heatmap of different zOTUs identified by ANCOM between db/db-IF and db/db on day 28 with FDR-p < 0.05. f A Z-score scaled heatmap of different pathways identified by an extraction of differential gene expression (Edge) between db/db-IF and db/db on day 28 with FDR-p < 0.1. g The difference in microbial metabolites in db/db and db/db-IF mice (n = 10 mice per group). Microbial metabolites that were up/downregulated after IF treatment. Differences were examined by Wilcoxon rank-sum test (*p < 0.05, **p < 0.01). IPA 3-indolepropionic acid, CA cholic acid, DCA deoxycholic acid, MCA muricholic acid, TUDCA tauroursodeoxycholic acid, 12-HEPE 12-hydroxyeicosapentaenoic acid. The boxplot elements are defined as following: center line, median; box limits, upper and lower quartiles; whiskers, 1.5 × interquartile range. See also Supplementary Figs. 4–6 and Supplementary Data 6–9. Source data are provided as a Source Data file.

