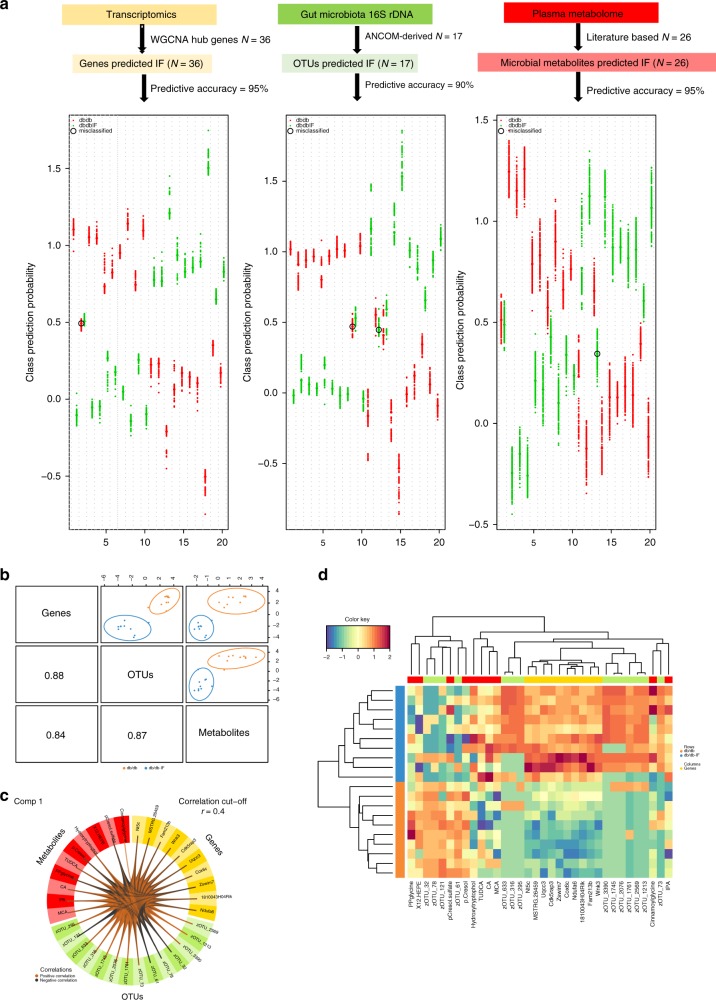
Fig. 5. Strategy and model performance of the integrative modeling on multi-OMICS in relation to IF treatment.
a The performance of predictive models for three OMICs signatures on IF status. OMICs signatures include: 36 IF-upregulated hub genes from the IF-related brown module that was identified using WGCNA; 17 OTUs that were found to be influenced by IF treatment; 26 priori defined sets of microbial metabolites, including 23 plasma metabolites and 3 SCFAs measured in fecal samples. For each OMICs data set, multivariate predictive modeling was conducted using partial least square-discriminant analysis incorporated into a repeated double cross-validation framework (rdcv-PLS). Prediction performance is shown in downstream figures: each swim lane represents one mice sample. For each sample, class probabilities were computed from 200 double cross-validations. Class probabilities are color coded by class and presented per repetition (smaller dots) and averaged over all repetitions (larger dots). Misclassified samples are circled. Predictive accuracy was calculated as a number of correctly predicted samples/total number of measured samples. b The model performance of DIABLO integrative modeling on OMICs signatures in relation to IF. The use of DIABLO maximized the correlated information between multiple data sets, i.e., genes, OTUs and metabolites, while optimally identifying in a parsimonious set of key OMICs variables relevant for IF status, i.e., ten key predictors from each of OMICs data sets. Scatter plots depicting the clustering of groups, i.e., db/db and db/db-IF, based on the first component of each data set from the model showed a significant separation between groups. A scatterplot displays the first component in each data set (upper diagonal plot) and Pearson correlation between components (lower diagonal plot). c The Circos plot shows the positive (negative) correlation, denoted as brown (gray) lines, between selected multi-OMICs features. d A clustered image map (Euclidean distance, complete linkage) of the multi-OMICs signature. Samples are represented in rows, selected features on the first component in columns. See also Supplementary Fig. 7. Source data are provided as a Source Data file. Detailed procedure and R code are provided in the Supplementary Information.

