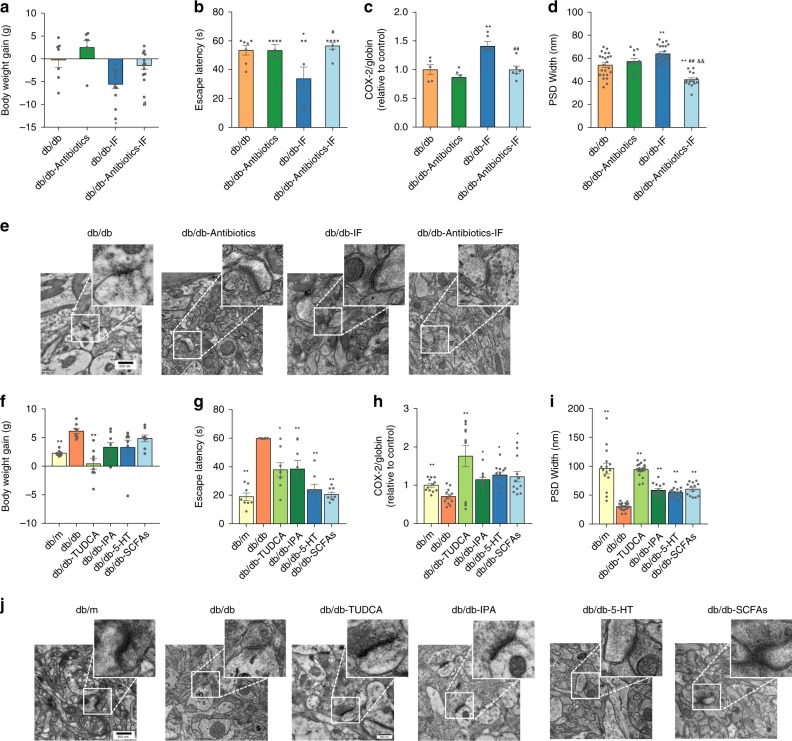
Fig. 6. The effects of antibiotics and microbial metabolites on the cognitive functions of IF-treated db/db mice.
The mice were administrated with antibiotics in the drinking water starting 14 days before the 4-week IF regimen and throughout the experiment (the detailed antibiotics treatment is as described in “Methods”). a Bodyweight gain (g) (n = 7 mice and 13 mice in ad libitum feeding and IF regimen groups, respectively). b Escape latency (s) in place navigation test (the 5th day). c Mitochondrial DNA levels in brain tissue (n = 7 mice per group); d width of PSD. e Representative images of ultrastructure of synapse (n = 6 slices per group). Data presented as mean ± SEM. *p < 0.05, **p < 0.01, compared with the db/db group, &p < 0.05, &&p < 0.01, compared with the db/db- antibiotics group, #p < 0.05, ##p < 0.01 compared with the db/db-IF group. Significant differences between mean values were determined by two-way ANOVA (IF regimen and antibiotics treatment as two factors) with Tukey’s multiple comparisons test. The db/db mice were administrated with IPA, 5-HT, TUDCA, or SCFAs, i.e., acetate, butyrate, and propionate, individually (n = 8 mice per group). f Bodyweight gain; g escape latency (s) in place navigation test (the 5th day) (n = 8 mice per group); h mitochondrial DNA levels in brain tissue (n = 8 mice per group); i width of PSD; and j representative images of ultrastructure of synapse (n = 6 slices per group). Data presented as mean ± SEM. *p < 0.05, **p < 0.01 versus the db/db group. Significant differences between mean values were determined by one-way ANOVA with Tukey’s multiple comparisons test. See also Supplementary Figs. 8–11, Supplementary Data 10. Source data are provided as a Source Data file.

