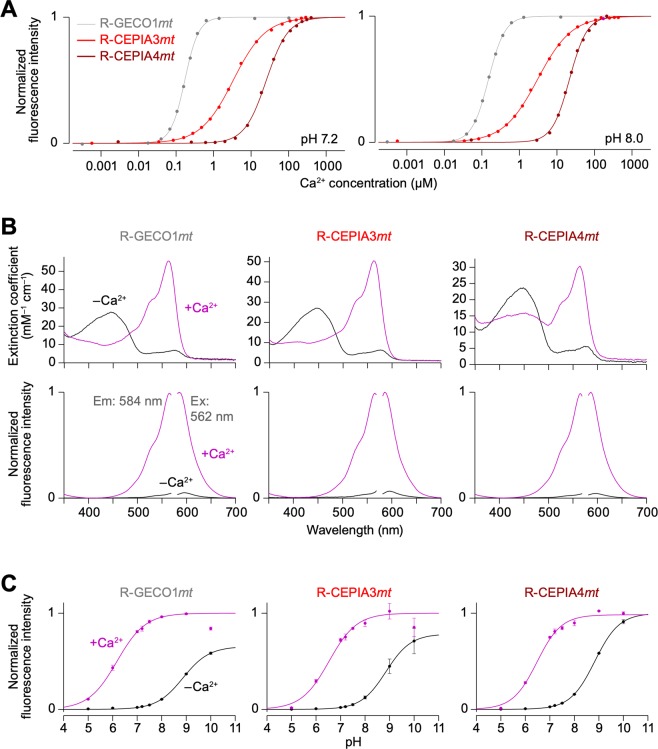
Figure 1.
In vitro characterization of R-CEPIA3mt and R-CEPIA4mt. All the extracted parameters are summarized in Table 1. (A) In vitro Ca2+ titration curves of R-GECO1mt (gray), R-CEPIA3mt (red) and R-CEPIA4mt (brown) at pH 7.2 (left) or 8.0 (right) solution. (B) Absorption (upper), excitation and emission (lower) spectra of R-GECO1mt (left), R-CEPIA3mt (middle) and R-CEPIA4mt (right) in Ca2+-containing (1 mM, magenta) or Ca2+-free (1 mM EGTA, black) solution. (C) pH titration curves of R-GECO1mt (left), R-CEPIA3mt (middle) and R-CEPIA4mt (right) in Ca2+-containing (1 mM, magenta) or Ca2+-free (1 mM EGTA, black) solution. The plots were fitted by a single Hill equation. Mean ± SEM (n = 3).

