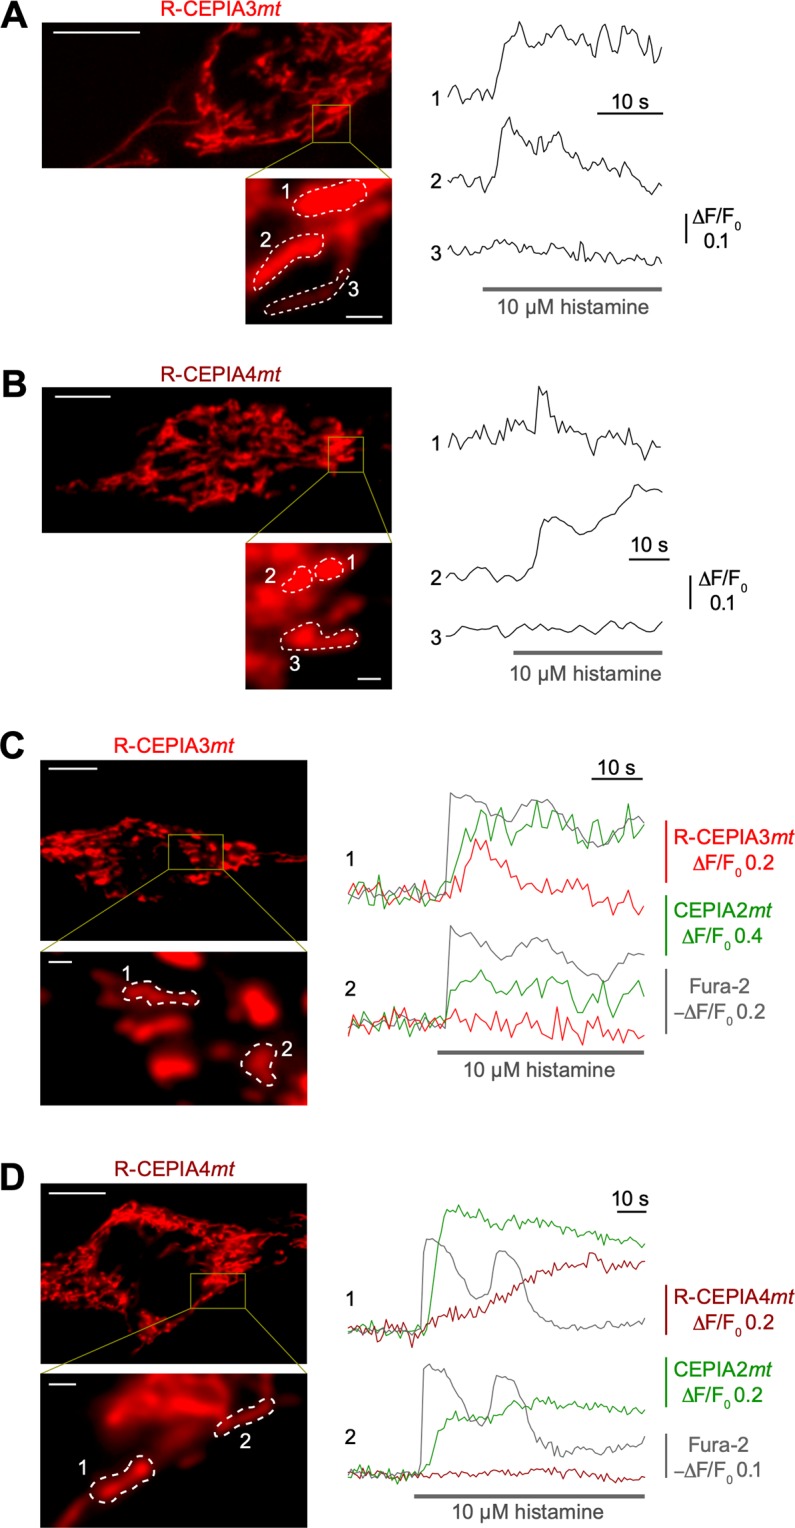
Figure 3.

Local mitochondrial Ca2+ signals visualized by R-CEPIA3mt and R-CEPIA4mt. (A,B) Representative red fluorescence images and time courses of agonist-induced Ca2+ signals in subcellular mitochondrial domains in a HeLa cell expressing R-CEPIA3mt (A) or R-CEPIA4mt (B). Regions of interest (ROI) are indicated in high magnification images shown in the left lower panels. Scale bars, 10 µm (upper) and 1 µm (lower). (C,D) Simultaneous Ca2+ imaging of mitochondria with low Ca2+ affinity R-CEPIAs (red fluorescence), high Ca2+ affinity CEPIA2mt (green fluorescence) and the cytosolic Ca2+ indicator, fura-2 (405-nm excitation). Representative red fluorescence images and time courses of agonist-induced Ca2+ signals in subcellular mitochondrial domains in a HeLa cell are shown. ROI are indicated in high magnification images shown in the left lower panels. The cells expressing both R-CEPIA3mt and CEPIA2mt (C), and both R-CEPIA4mt and CEPIA2mt (D) were loaded with fura-2. Scale bars, 10 µm (upper) and 1 µm (lower).
