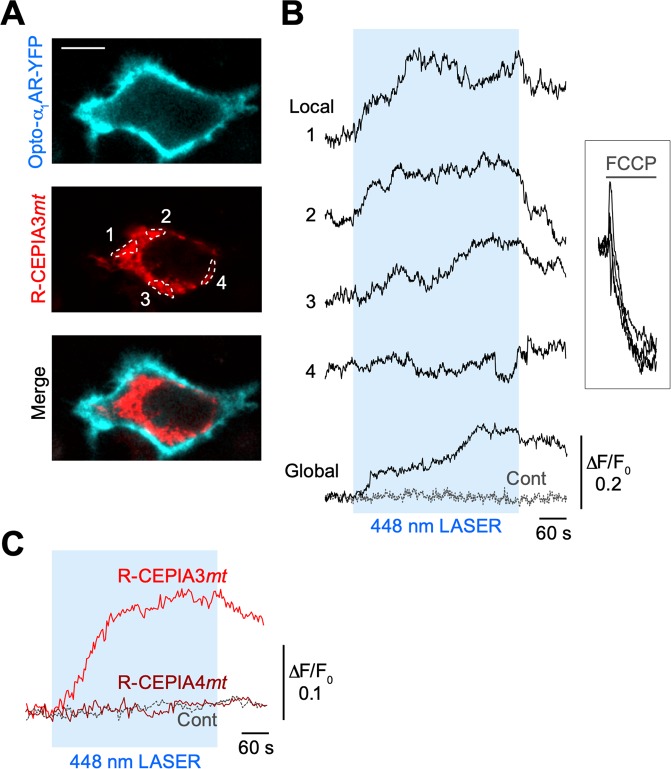
Figure 4.
Simultaneous application of mitochondrial Ca2+ imaging and an optogenetic activator of the Ca2+ release machinery. (A) Representative confocal section images of Opto-α1AR-YFP and R-CEPIA3mt in a transfected HeLa cell. A merged image is shown in the lower panel. Scale bar, 10 µm. (B) Time courses of R-CEPIA3mt-reported Ca2+ signals in the subcellular mitochondrial domains indicated in (A) (Local; ROI 1–4). Laser irradiation (448 nm) during the period indicated by the blue box was used to activate Opto-α1AR-YFP, which is a chimera protein of rhodopsin, α1-adrenergic receptor and YFP. Traces in the right box show Ca2+ responses during bath application of the mitochondrial uncoupler, FCCP. Time courses of global mitochondrial Ca2+ signals in the same cell and in a negative control cell expressing R-CEPIA3mt (without expressing Opto-α1AR-YFP) in the same culture dish are shown at the bottom (Global and Cont). (C) Averaged time courses of optogenetics-induced global mitochondrial Ca2+ signals that were reported by R-CEPIA3mt (red) or R-CEPIA4mt (brown). As a control, the averaged response of HeLa cells transfected with only R-CEPIA3mt is shown (grey dashed line). n = 6, 3 and 3 cells for R-CEPIA3mt, R-CEPIA4mt and control, respectively, from 2 culture dishes each.

