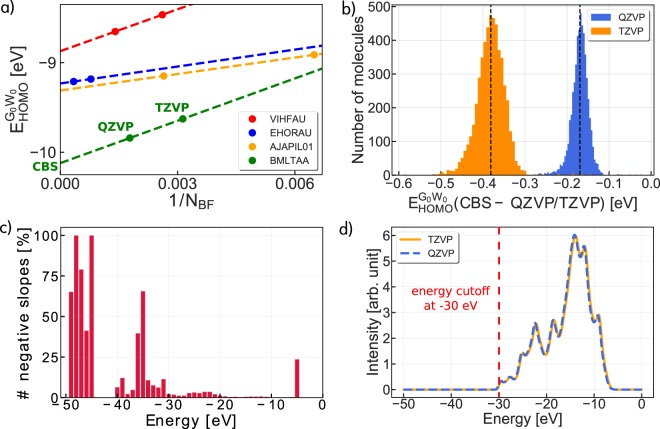
Fig. 6.
Accuracy assessment of G0W0 quasiparticle energies. (a) Convergence of the HOMO G0W0 energies with respect to the inverse of the number of basis functions NBF for the four example molecules shown in Fig. 5. Dashed lines represent linear straight line fits using the def2-QZVP and def2-TZVP points. The intersection of the straight line with the ordinate gives an estimate for the complete basis set limit (CBS) as indicated for BMLTAA. (b) Deviation of the HOMO G0W0 energies from the CBS limit for the 5 k subset. Median values of the distributions are indicated by black dashed lines. (c) Percentage of states with negative slope of the CBS fit. (d) Average G0W0@PBE0 quasiparticle spectrum, where each energy state was artificially broadened by a Gaussian distribution.

