
Figure 3.
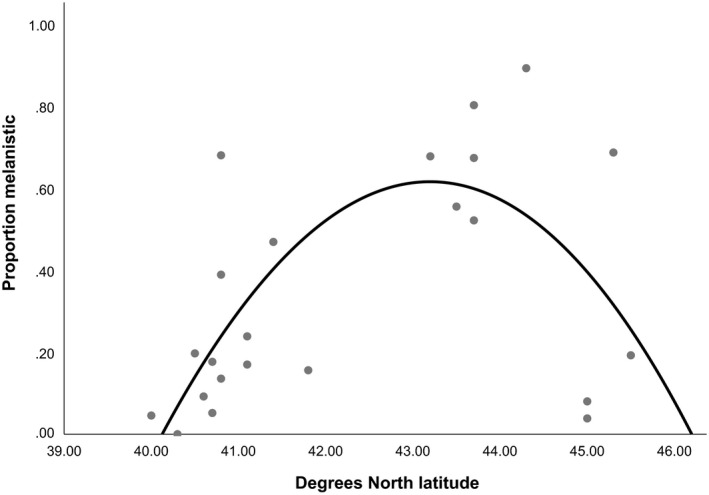
Relationship between the proportion of sampled squirrels that were melanistic (minimum sample size n = 50) from 23 localities in the http://iNaturalist.org database and degrees north latitude. The curve indicates a cubic function (F = 8.03, df = 22, p = .03, R 2 = .445; y = −0.001x 3 + 813.8x 2 + 2.885x − 82.478)