
Figure 7.
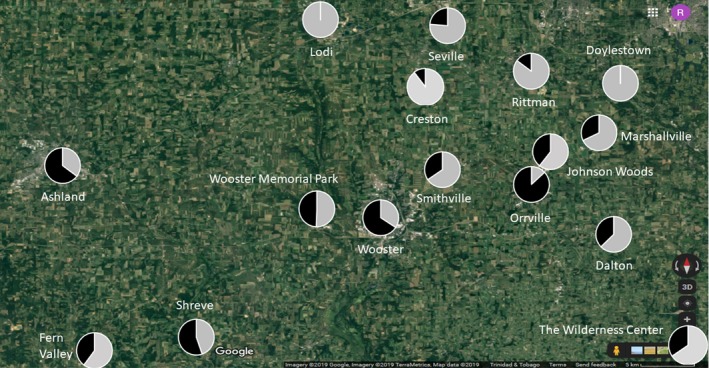
Map of the region surrounding Wooster, Ohio (USA). Each pie shows the proportion of gray morph (light shading) and black morph (dark shading) individuals observed in that population (n = 16). Minimum sample size = 100 squirrel observations per population. See Table S15 for full details