
Figure 3.
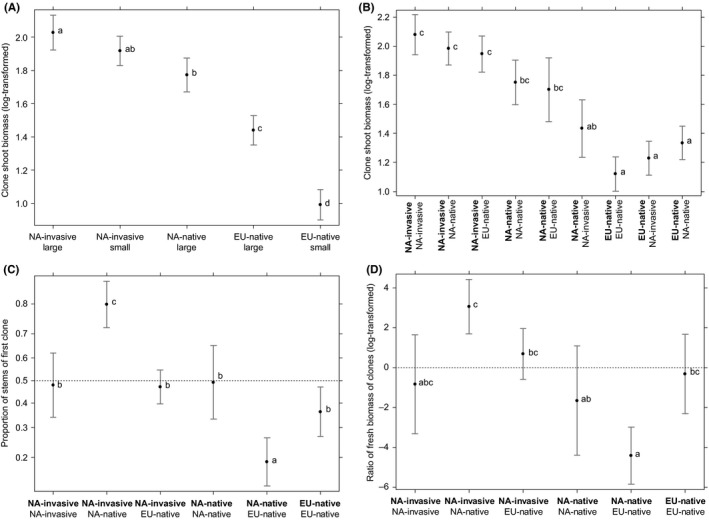
(A) Clone shoot biomass in relation to status (NA‐invasive, NA‐native, EU‐native) and genome size of the competitor. One combination (NA‐native with small genome size) is missing as it does not occur in nature. (B) Target clone shoot biomass (listed first, in bold) in relation to its status and that of its competitor. (C) Proportion of shoots of target and competitor clone in relation to their status. Target clone listed first in bold. (D) Ratio of target and competitor clone fresh biomass in relation to their status. Target clone listed first in bold. Group means are based on estimated models and are shown with 95% confidence intervals. Only tetraploid clones are included in these comparisons