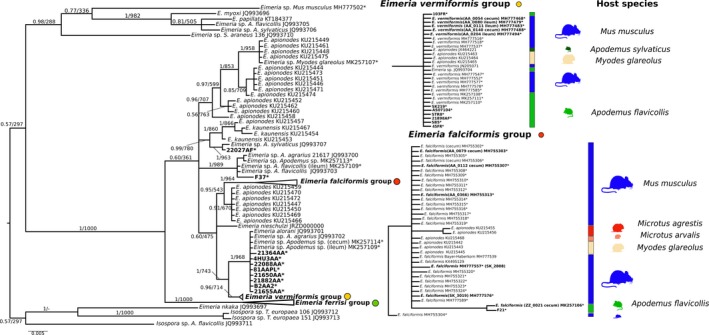
Figure 3.

Phylogenetic trees inferred from mitochondrial cytochrome c oxidase (COI) sequences. Phylogenetic tree based on COI. Numbers in the branches represent Bayesian posterior probability and bootstrap value. The three collapsed groups cluster Eimeria sequences from Mus musculus of this study. Reference sequences from other rodents were included. The scale bar represents sequence divergence. Hosts for closely related sequences of E. falciformis and E. vermiformis are indicated in the expanded form of the group. * represents sequences generated in the present study. Tissue of origin is indicated in brackets. Sequences in bold were included in the multimarker phylogenetic inference
