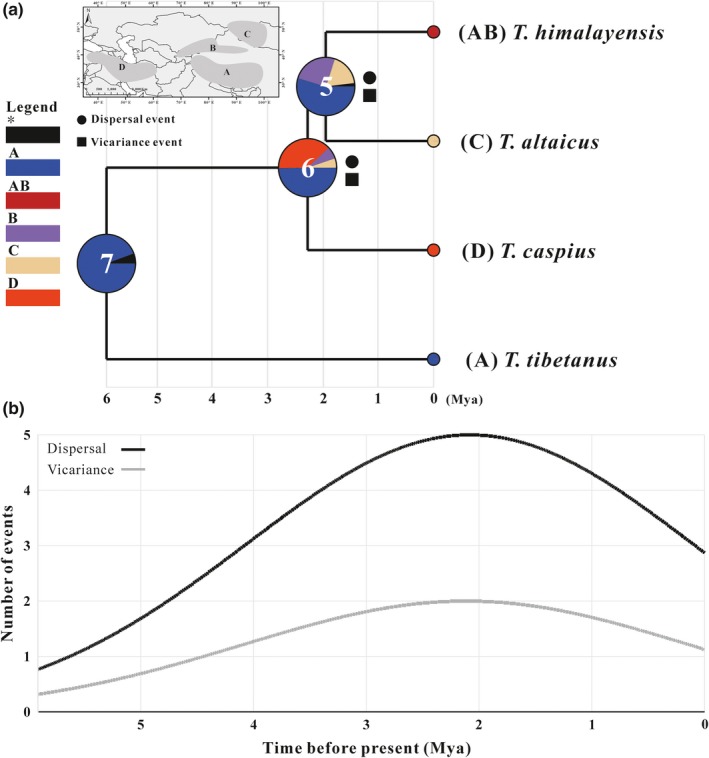
Figure 3.

Diagram of ancestral distribution ranges is estimated using BBM analysis (output from RASP). (a) Biogeographical areas used in RASP analysis are divided into four regions (Top‐left). The possible ancestral range is estimated by BBM based on each node of the phylogeny of the genus Tetraogallus, and Pie charts at each node show probabilities of alternative ancestral ranges. (b) The frequency of biogeographic events of snowcocks changes over time
