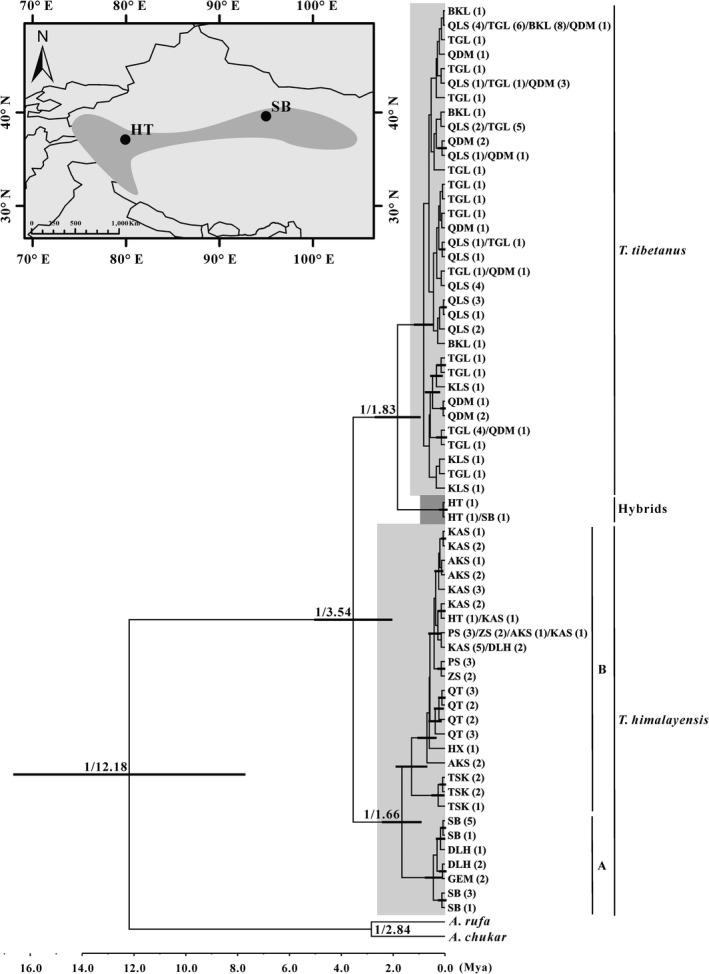
Figure 5.

A chronogram of population divergence between T. tibetanus and T. himalayensis based on D‐loop haplotypes. The divergence time is estimated using the BEAST with the calibration method under the strict clock model (using the estimated mutation rate). Branch lengths represent the mean values of the posterior distribution. The posterior probability and divergence time are indicated at the major inner nodes, and population names are provided in Table A2. The node bars indicate the posterior probability distribution of the node age under the 95% CI. Proposed hybridization zone of T. tibetanus and T. himalayensis is marked in dim gray shade (Top‐left)
