
Figure 3.
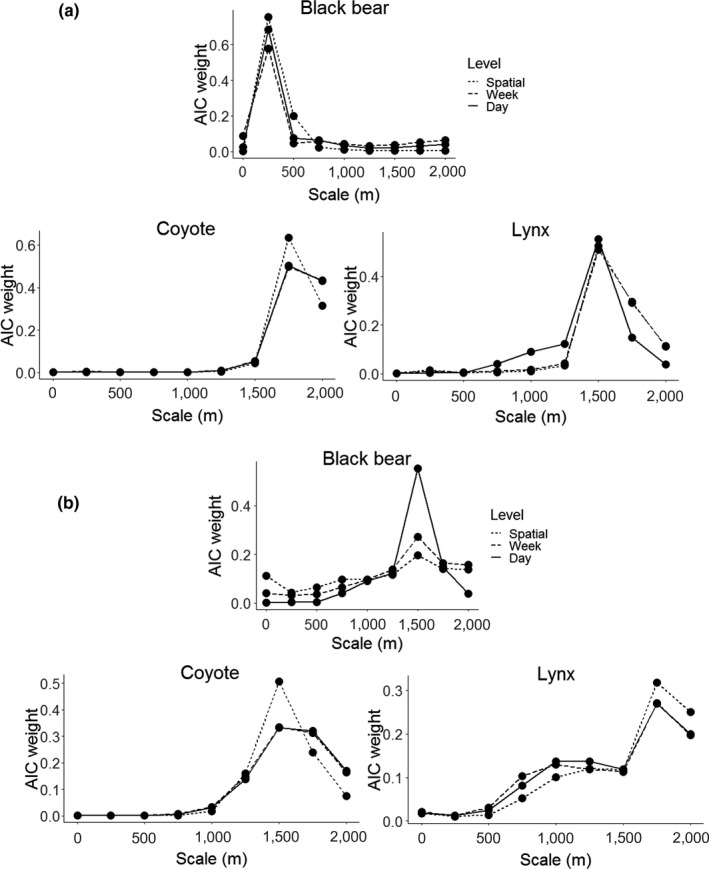
AIC model weights indicating scale of influence for habitat features (a) and linear density (b). The scale with the most model weight indicated the scale that best explains occurrences of each predator species, as determined by using AIC model selection to compare identical models measured at different spatial scales