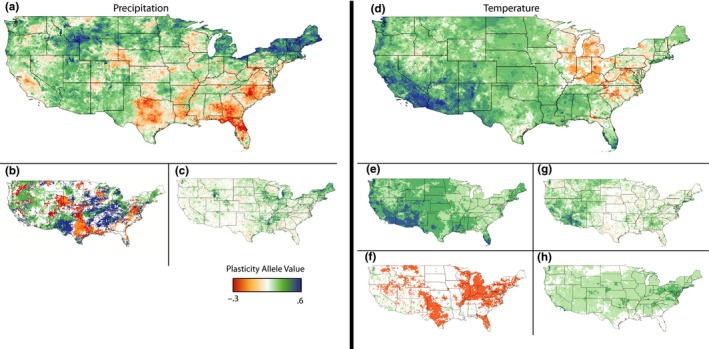
Figure 4.

Maps coded to show patterns of variability for optimal precipitation (a–c) and temperature (d–h) plasticity values across the United States. (a) Optimal transgenerational plasticity values for the one‐generation transmission of precipitation level information. (b) Optimal grandparental transgenerational plasticity values coded blue (green) or red (orange) based on the direction of effect (positive or negative). White regions have an optimal multigeneration persistence (G) of 0, while red and blue both have optimal multigeneration persistence of 1, intermediate values (0 > G > 1) in orange and green. (c) The difference between optimal transgenerational plasticity values in the raw versus. residual variant of the mode. Higher values suggest that the primary value associated with transgenerational plasticity over the past 120 years has been associated with allowing individuals to keep up with linearly changing precipitation patterns. (d) Optimal total levels of transgenerational temperature plasticity ((M EE + M EL + M LE + M LL)/2). (e) Optimal transgenerational plasticity of most extreme positive transgenerational plasticity allele. (f) Optimal transgenerational plasticity of lowest transgenerational plasticity allele. Regions in orange have at least one form of transgenerational plasticity for which negative transgenerational effects increase fitness. (g) The difference between optimal transgenerational plasticity values in the raw versus residual variant of the mode. Higher values suggest that the primary value associated with transgenerational plasticity over the past 120 years has been associated with allowing individuals to keep up with increasing temperature. (h) Optimal within‐generation plasticity (W) values
