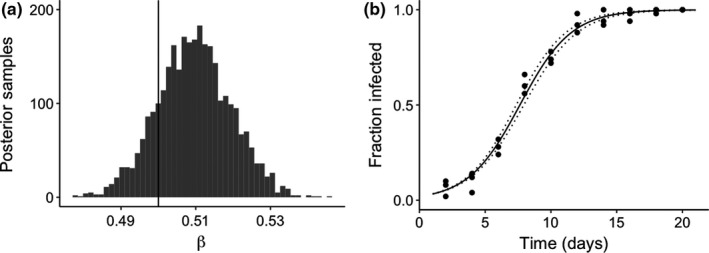
Figure 3.

Graphs represent fitting a simple susceptible‐infected (SI) model to hypothetical experimental data. In this experiment, a single‐infected host was released in a population of 49 susceptible hosts, and this was replicated across three host populations. Symbiont transmission occurs horizontally, from infected individuals to susceptible individuals. We simulated the data based on the SI model, adding observation error, and setting the transmission rate to 0.50 day−1 host−1. The model was then fit to the synthetic data with Stan using 3 Hamiltonian Monte Carlo chains, with a 2,000 iteration warm‐up period, and 5,000 total iterations, thinning by 3. A vague prior (N(0, 5)) was used for the transmission rate. (a) Marginal posterior estimate of transmission rate, with vertical line delineating the true parameter value (0.50). (b) Fit of the model (median and 95% credible interval) to time‐series data of the fraction of the population infected, where the three populations were sampled every 2 days of the experiment
