
Figure 4.
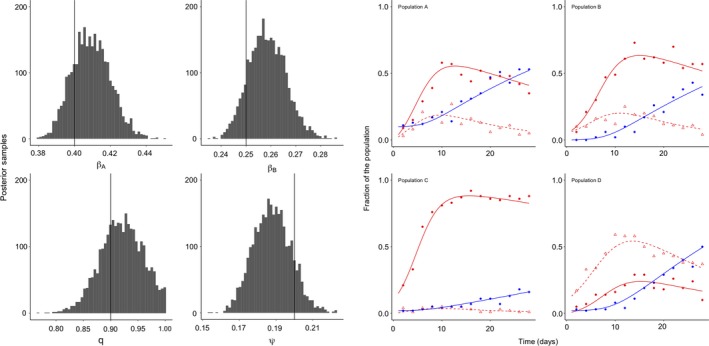
Fitting the two symbionts—one host species SI model to synthetic data, from Box 2 “Multisymbiont model and experiment” section. Four populations of 100 hosts were exposed to variable initial numbers of hosts infected with symbiont A (closed red circles, red line), symbiont B (open red triangles, dashed red line), or coinfected with both symbionts (closed blue circles, blue line). Experimentally manipulating the initial conditions enables us to estimate the parameters with more power, because we observe more variable dynamics in the system. Specifically, the initial conditions for each simulated population () are as follows: (a) 90, 0, 0, 10; (b) 90, 5, 5, 0; (c) 88, 10, 0, 2; (d) 88, 0, 10, 2. We chose these values to demonstrate that the transient dynamics of the model are influenced by subtle changes to initial conditions, and we should see these dynamics reflected in the experimental data. Again, the model was fit to the synthetic data with Stan using vague priors for each of the four parameters, and 5,000 total sampling iterations. Graphs in the left‐hand panel show the marginal posterior samples for each parameter, with the vertical line delineating the true parameter value. To reiterate, the parameters are as follows: and are the transmission rates of the two symbionts, respectively; modulates the likelihood that susceptible hosts become infected through contact with coinfected hosts (i.e., would mean that there was an equal likelihood of susceptible hosts being infected by single‐ or coinfected hosts); and modulates the likelihood that single‐infected hosts will become coinfected by a secondary symbiont. Graphs in the right‐hand panel depict the simulated, synthetic data, where the fraction of hosts infected with one or both pathogens changes over time. The lines represent the median model predictions. Only median posterior model predictions are shown, for clarity