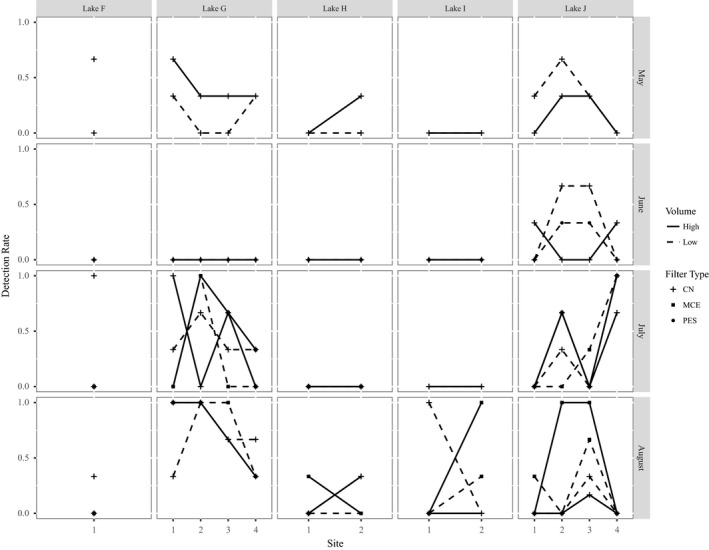
Figure 4.

Comparing environmental DNA detection rates across sampling sites in lake protocol locations for different filter types. Detection rates are the number of qPCR replicates with a yellow‐legged frog detection/total number of replicates analyzed. All the lakes were occupied by Rana sierrae. Filter type 1 was the 0.45 μm CN filters and was used across all sampling occasions. On sampling occasion 2, filter type 2 was the 5 μm PES filters. For sampling occasions 3 and 4, filter type 3 was the 5 μm MCE filters
