
Figure 2.
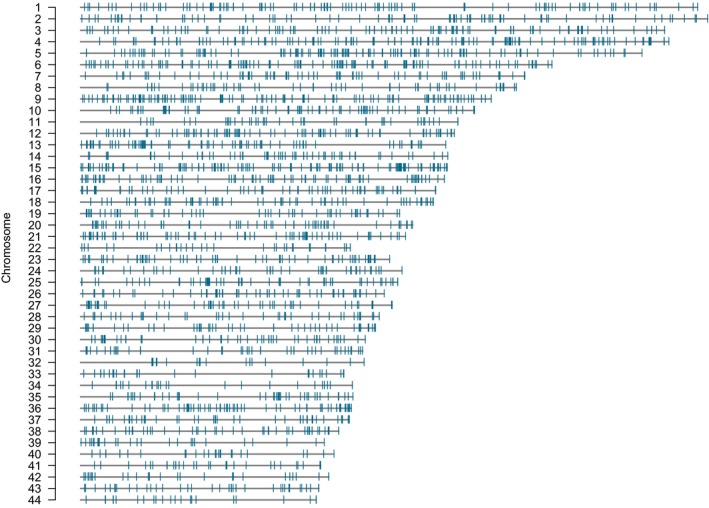
Distribution of target RAD loci across the 44 largest scaffolds (>10 MB) in the sea lamprey genome. Each horizontal black line represents a scaffold, and each vertical blue line represents the location of a targeted locus. A total of 2,844 of 3,446 (82.5%) targeted loci map to these scaffolds