
Figure 4.
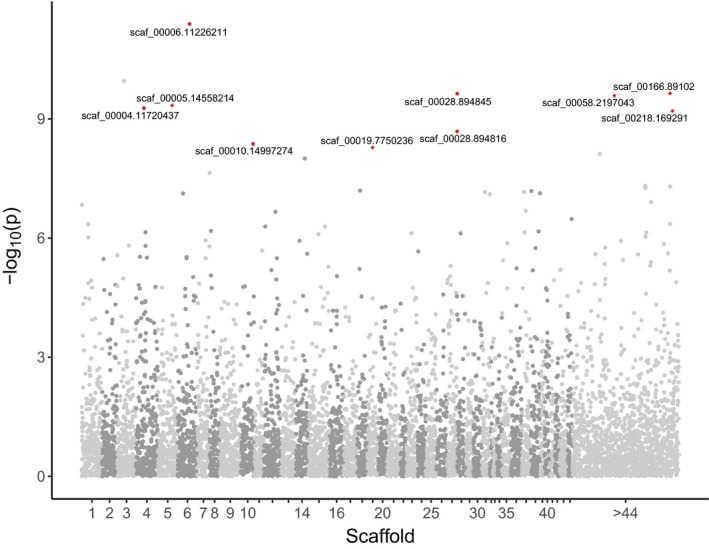
Manhattan plot showing distributions of ‐log10‐transformed p‐values associated with interpopulation F ST for genotyped SNPs. Outlier loci detected using OutFLANK are labeled and shown in red along with scaffold and position (bp)
Official websites use .gov
A
.gov website belongs to an official
government organization in the United States.
Secure .gov websites use HTTPS
A lock (
) or https:// means you've safely
connected to the .gov website. Share sensitive
information only on official, secure websites.
Manhattan plot showing distributions of ‐log10‐transformed p‐values associated with interpopulation F ST for genotyped SNPs. Outlier loci detected using OutFLANK are labeled and shown in red along with scaffold and position (bp)