
Figure 7.
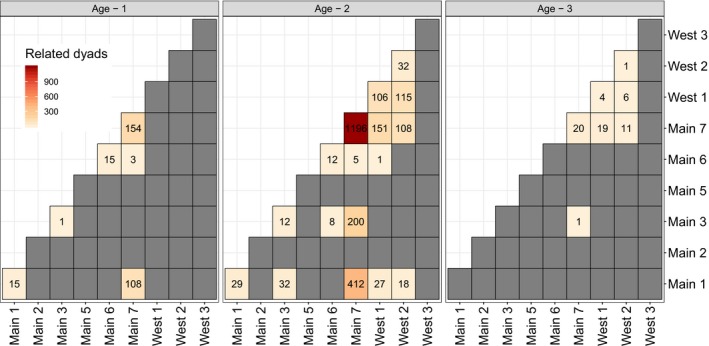
Heatmaps representing related dyadic relationships observed for age‐1 (n = 38), age‐2 (n = 146), and age‐3 (n = 30) larval sea lamprey among sampling locations in Duffins Creek (Figure 1). Darker red colors indicate more related dyads observed. Actual dyads observed per pairwise (location) comparison are reported within corresponding cells. Gray cells represent no dyads observed. Note cells along the diagonal represent dyadic relationships within sampling location and that location “Main 4” was not included because none collected from that location (n = 3) were successfully genotyped