
Figure 3.
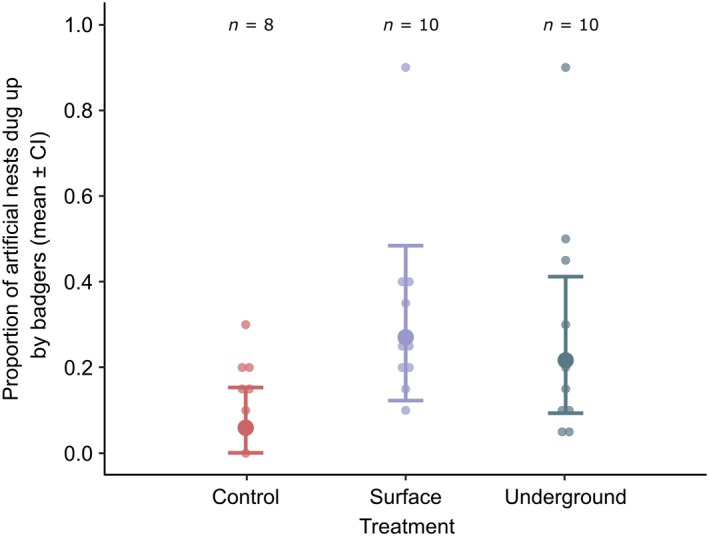
The proportion of artificial nests dug up by badgers for each treatment: control, surface, and underground. The raw data are displayed with a beeswarm plot and show the mean proportion of artificial nests dug up per transect block. The averaged predicted data and confidence intervals from the two top models (Table 2) are shown. The number of transect blocks (n) are shown above each plot