
Figure 3.
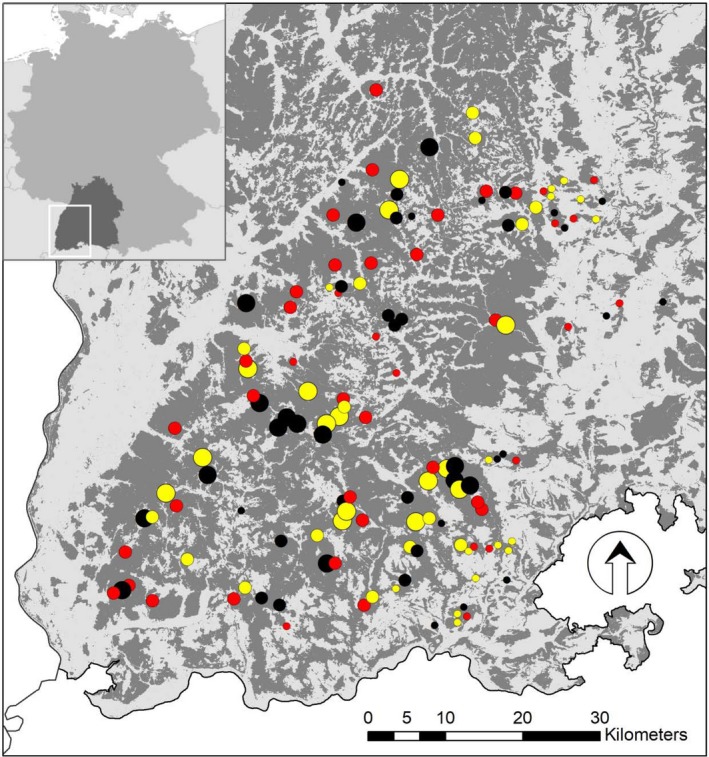
Location of the 135 ConFoBi study plots in the Black Forest (main map; light gray: open land; dark gray: forest), and in Germany and the State of Baden‐Württemberg (insert). All plots are 1 ha in size and >750 m apart. Point size indicates three levels of landscape‐scale forest connectivity (small <50%, medium 50%–75%, large >75% forest cover) in the 25 km2 surrounding a plot. Point color indicates three levels of plot‐scale forest structure (red: 0, yellow 1–9, black ≥20 standing dead trees per ha). Plots richest in structure (≥20 standing dead trees) include stands >200 years of age and plots in strict forest reserves, where harvesting has been excluded