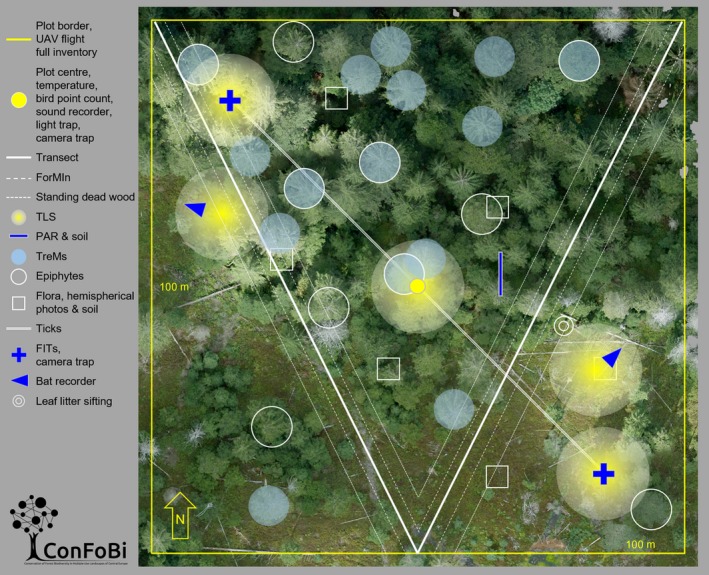
Figure 4.

Schematic overview of the sampling design on the ConFoBi study plots. All plots are 1 ha in size and north south aligned. Wooden poles mark the plot center as well as all four corners and all four sides. The center point is permanently marked with a white plastic reference point and a strong magnet on ground level. Trees along the borders and in the corners of the plot are also marked with long lasting light blue color. The following measurements are collected on all 135 study plots, except for a few additional measurements, for example, for pilot studies, that are taken on subsets of plots (n plots in brackets) only: Flights with unmanned aerial vehicles covering the whole plot, within the whole plot full inventory of all trees with a DBH above 7 cm as well as full presence list of all herbaceous plants; at the center point temperature, bird counts, automatic acoustic recorders for soundscapes, light traps for moths (n = 28); automatic camera traps for large mammals at the center point and the locations of the Flight Interception Trap (FIT); a V‐transect is aligned from the north‐western corner via the central point of the southern border to the north‐eastern corner, data for the ForMIn (Forest management Index) within a 4m wide strip and data on standing deadwood within a 10 m wide strip are collected; terrestrial laser scans (TLS) on five locations (plotcenter, two bat recording, two insect collecting sites); light measurements (photosynthetic active radiation = PAR) along a transect subdivided into twelve subplots of 40 cm × 40 cm plus one soil sample from the middle of the transect, the transect was placed north south in the grid cell of 10 m × 10 m with the highest variability of crown height of each study plot; tree microhabitats (TreMs) on the fifteen trees with the largest crown identified from aerial images; epiphytes on the five trees with the largest crown identified from aerial images and on five trees of the most common species and of average DBH of each plot; ticks are collected with a 1 m × 1 m flag along a 100 m transect aligned north‐west to south‐east through the center point in four 25 m steps (n = 34); six floral subplots of 5 m × 5 m which detail species list plus cover, in addition one soil sample and one hemispherical photograph were taken at the center of each subplot; FIT in the north‐western and south‐eastern area of the plot; automatic acoustic bat recorders placed in one area of the plot with high structure and one area with low structure; sifting leaf litter for weevils, centipedes, and millipedes along deadwood next to beech trees (n = 43)
