Figure 6.

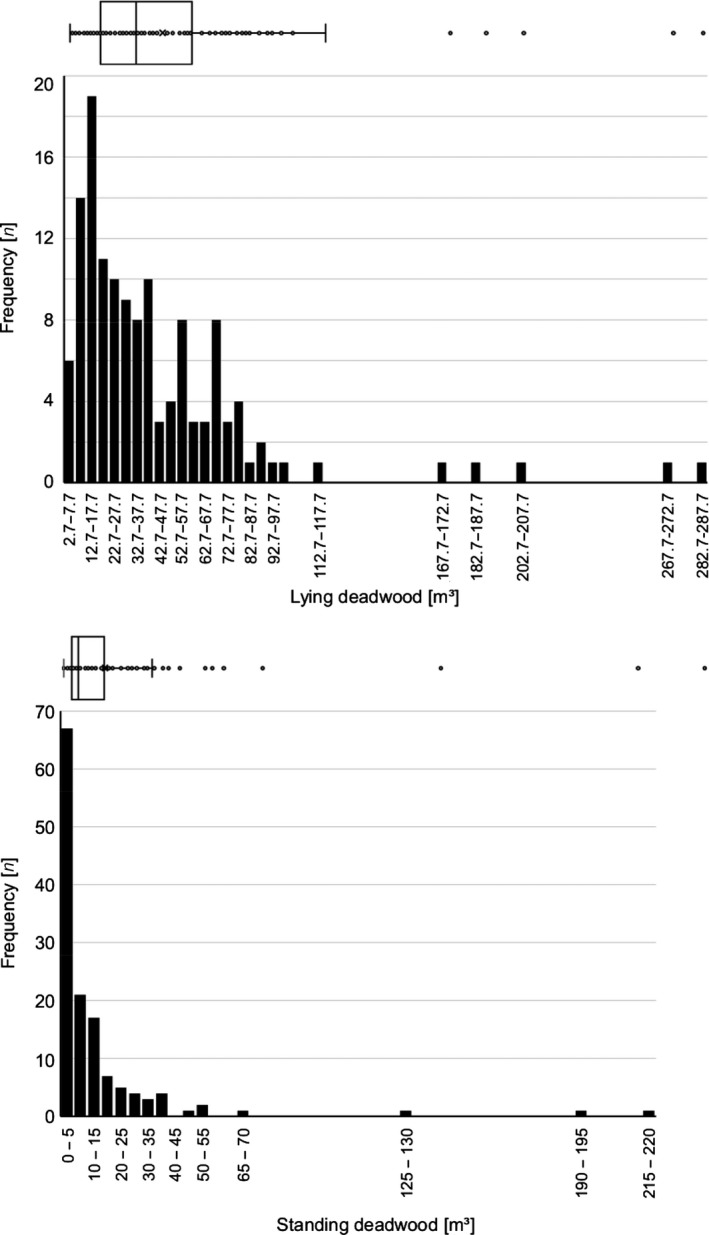
Gradients of forest structure at the plot scale. Boxplots and frequency distributions of the amount of lying (top) and standing (bottom) deadwood on the 135 study plots (1 ha)

Gradients of forest structure at the plot scale. Boxplots and frequency distributions of the amount of lying (top) and standing (bottom) deadwood on the 135 study plots (1 ha)