Figure 1.
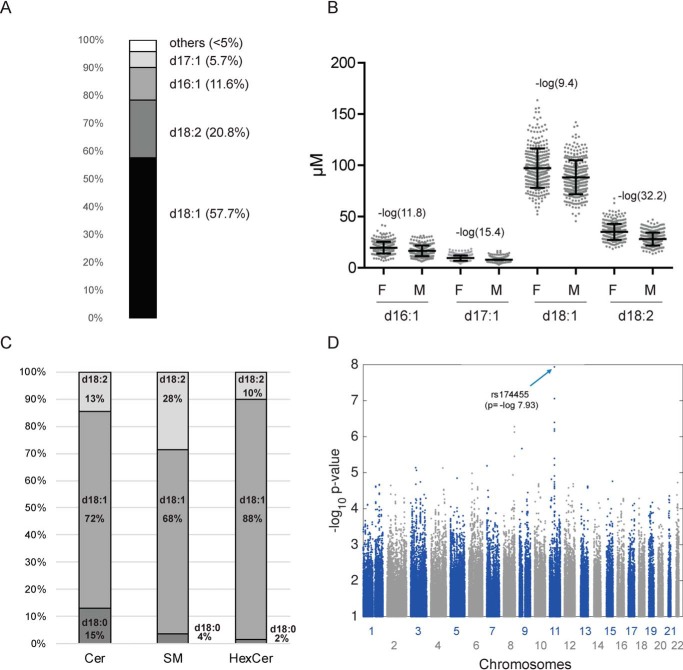
LCB profiling and genetic associations. A and B, long-chain base profile in human plasma. A, relative distribution of the most abundant LCBs in human plasma. B, differences in the concentration of the major plasma LCBs between females (F) and males (M). C, relative distribution of the LCB species d18:0, d18:1, and d18:2 in Cer, HexCer, and SM in human plasma. The LCBs reflect the sum of Cer (C16:0, C18:0, C20:0, C22:0, C24:0, and C24:1), SM (C16:0, C18:0, C20:0, C22:0, C24:0, and C24:1), and HexCer (C16:0, C22:0, C24:0, and C24:1). D, Manhattan plot of the GWAS revealed SNP rs174455 on Chromosome 11 to be significantly associated with the d18:1/d18:2 ratio (p = −log 7.93). Error bars, S.D.

