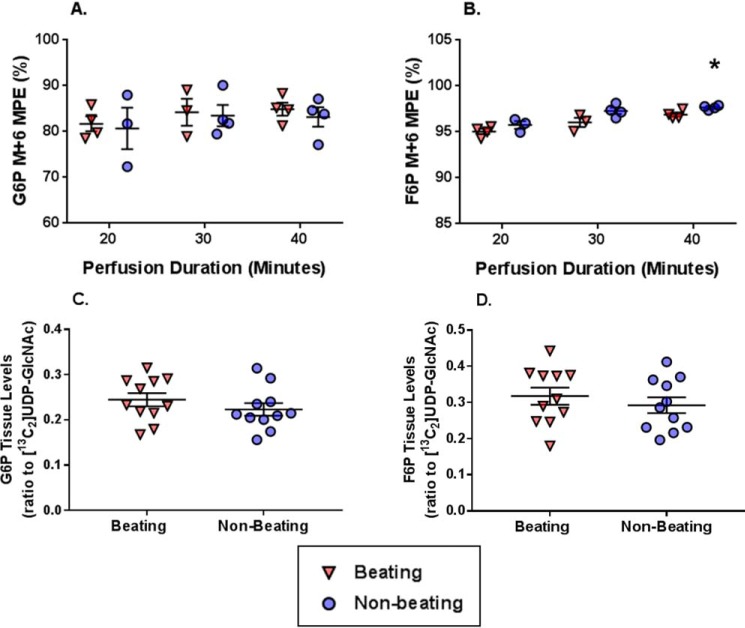
Figure 10.
The effect on reducing cardiac workload via Langendorff perfusions on 13C-labeling and concentration of metabolites relevant to glycolysis, including precursors for the HBP. A, G6P M+6 molar percentage enrichment (MPE). B, F6P M+6 MPE. C, G6P tissue levels (ratio to [13C2]UDP-GlcNAc internal standard). D, F6P tissue levels (ratio to [13C2]UDP-GlcNAc external standard). Horizontal bars, means ± S.E. (error bars). For A and B, n = 4 for Beating 20 min, n = 3 for Nonbeating 20 min, n = 3 for Beating 30 min, n = 4 for Nonbeating 30 min, n = 4 for Beating 40 min, and n = 4 for Nonbeating 40 min. For C and D, the values did not change over time and are shown as combined groups with n = 11 for Beating and n = 11 for Nonbeating. *, p < 0.05 Beating versus Nonbeating at the same perfusion duration; ‡, p < 0.05 Beating versus Nonbeating.

