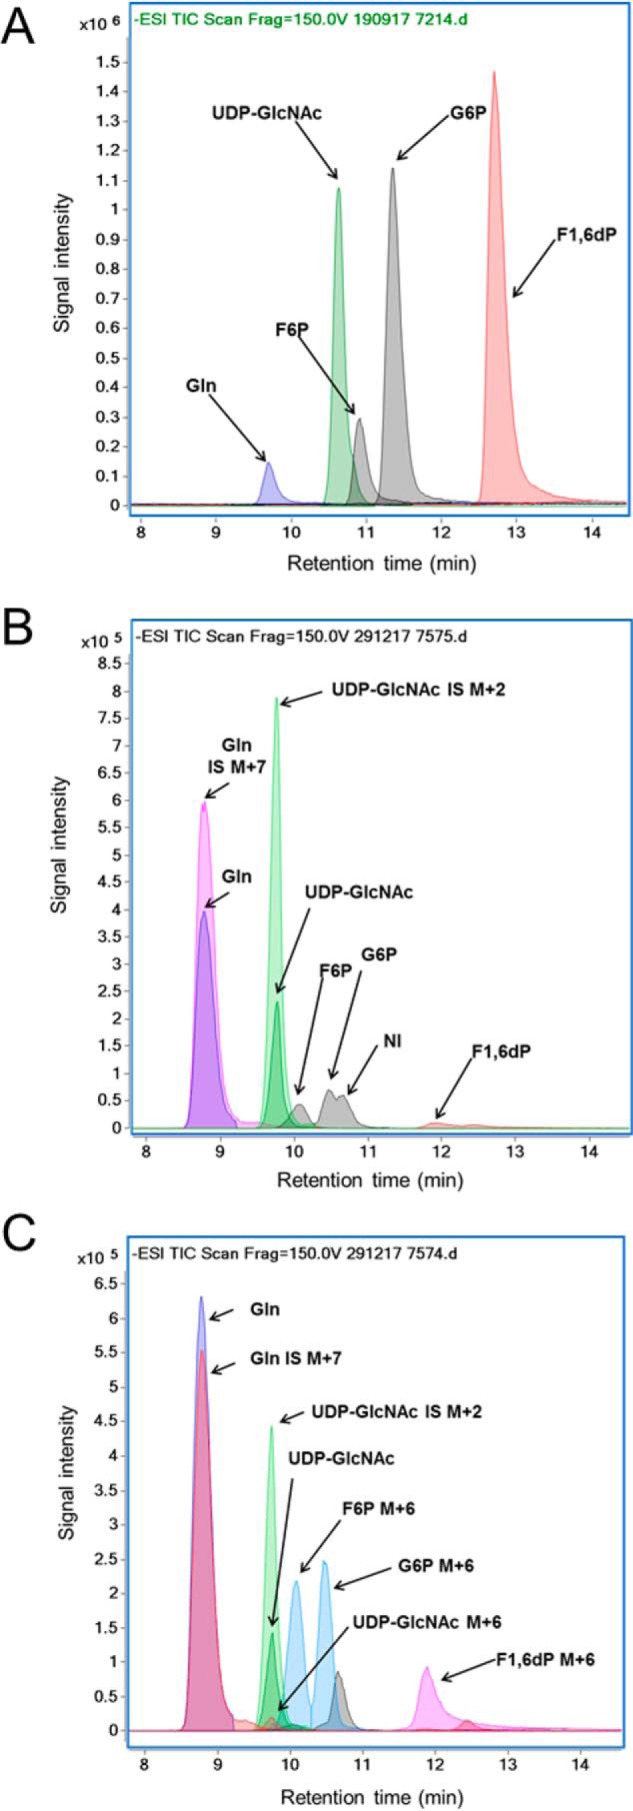
Figure 2.

Chromatographic separation using LC-QToF of UDP-GlcNAc, Gln, G6P, F6P, and F1,6dP in a representative sample of standard solution (A) and 50 mg of tissue extract from a heart without (B) or with (C) perfusion with 10 mm [U-13C6]glucose (MPE = 99%) added to 4 nm of [13C2]UDP-GlcNAc and 150 nm of [13C5,15N2]glutamine. Signal intensity is shown for the extracted ion chromatograms at the following m/z: UDP-GlcNAc, 606.0743 (unlabeled), 608.0815 (M+2), and 612.0944 (M+6); Gln, 145.06119 (unlabeled) and 152.0727 (M+7); G6P, 259.0224 (unlabeled) and 259.0224 (M+6); F6P, 259.0224 (unlabeled) and 259.0224 (M+6); and F1,6dP, 338.9888 (unlabeled) and 345.0089 (M+6).
