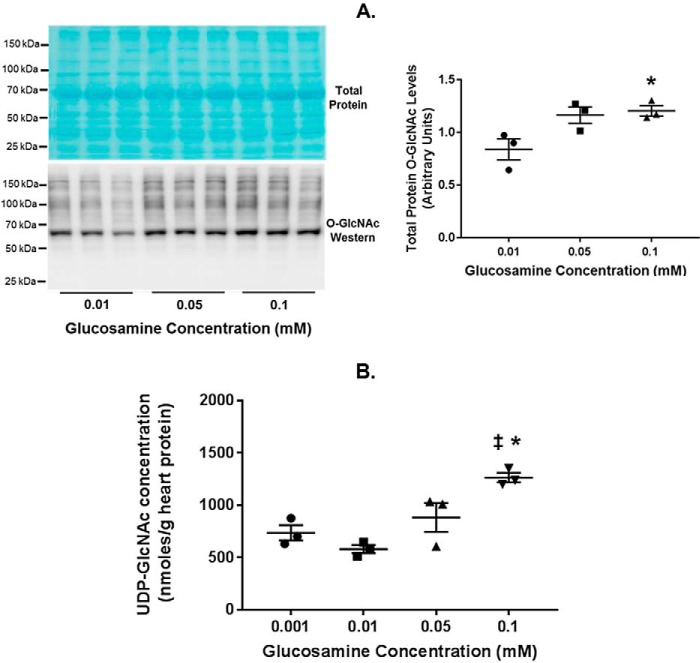
Figure 4.
Total tissue protein O-GlcNAc levels and UDP-GlcNAc concentrations in glucosamine working heart perfusions. A, immunoblot for total protein O-GlcNAc levels in the indicated glucosamine concentrations. Total protein O-GlcNAc levels were normalized to the total protein stain (shown). B, UDP-GlcNAc concentrations normalized to heart protein in the indicated glucosamine concentrations. Bars, means ± S.E. (error bars); n = 3 for all groups. *, p < 0.05 between the indicated group and the 0.01 mm glucosamine concentration; ‡, p < 0.05 between glucosamine 0.1 and 0.001 mm. In A, p = 0.058 between 0.01 and 0.05 mm glucosamine.

