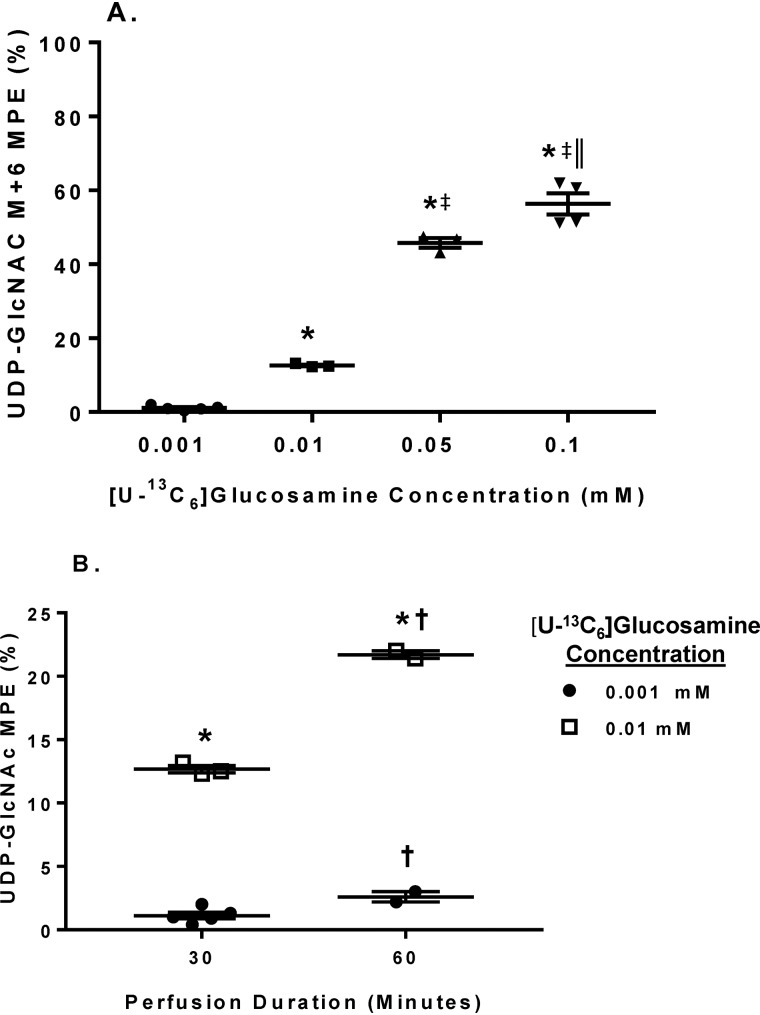
Figure 5.
The effect of various [U-13C6]glucosamine concentrations and perfusion durations on tissue UDP-GlcNAc M+6 MPE. A, changes in UDP-GlcNAc M+6 MPE in response to increasing [U-13C6]glucosamine concentrations. B, effect of perfusion duration for the indicated [U-13C6]glucosamine concentrations on UDP-GlcNAc M+6 MPE. Horizontal bars, means ± S.E. (error bars). In A, n = 5 for 0.001, n = 3 for 0.01, n = 3 for 0.05, and n = 4 for 0.1. In B, n = 5 for 0.001 mm 30-min perfusions, n = 2 for 0.001 mm 60-min perfusions, n = 3 for 0.01 mm 30-min perfusions, and n = 2 for 0.01 mm 60-min perfusions. For A, *, p < 0.05 between 0.001 and the indicated groups; ‡, p < 0.05 between 0.01 and the indicated groups; ‖, p < 0.05 between 0.05 and 0.1. For B, *, p < 0.05 between the [U-13C6]glucosamine concentrations at the same perfusion duration; †, p < 0.05 for the same [U-13C6]glucosamine concentration at 60 min versus 30 min.

