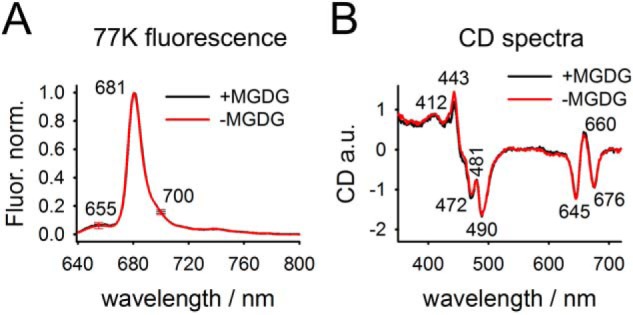
Figure 2.

Spectroscopic characterization of LHCII-proteoliposomes. A, representative chl fluorescence spectra of +MGDG and −MGDG proteoliposomes. Note the low emissions at 655 nm (indicative for chl b) and 700 nm (indicative for LHCII aggregates). Error bars at both wavelengths represent S.D. from 13 biological repetitions. B, room temperature CD spectra. The spectra show the mean of two biological replicates per sample type. A CD spectrum for the pure buffer was subtracted. Characteristic wavelength for LHCII trimer and protein aggregation are indicated (see text for details).
