Figure 3.

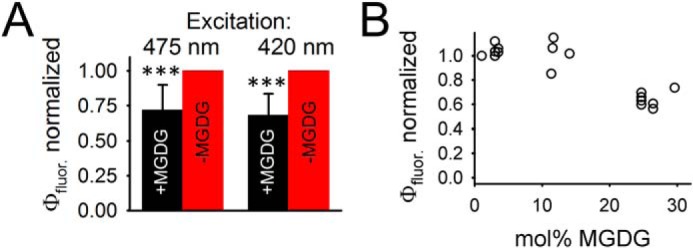
Quantum yields in fluorescence emission (Φfluor). A, comparison of Φfluor for +MGDG and −MGDG proteoliposomes measured for 475 nm and 420 nm excitation (indicated). The data were measured on pairs of +MGDG and −MGDG proteoliposomes prepared at the same day. Φfluor for +MGDG was normalized to the same day −MGDG counterpart (set to 1). Data are from 11 pairs. Error bars represent S.D. and ***, indicates p value of <0.001 (Student's t test). The mol % of the +MGDG samples is about 20%. B, dependence of mol % MGDG in proteoliposomes on Φfluor. The mol % of MGDG was determined by TLC.
