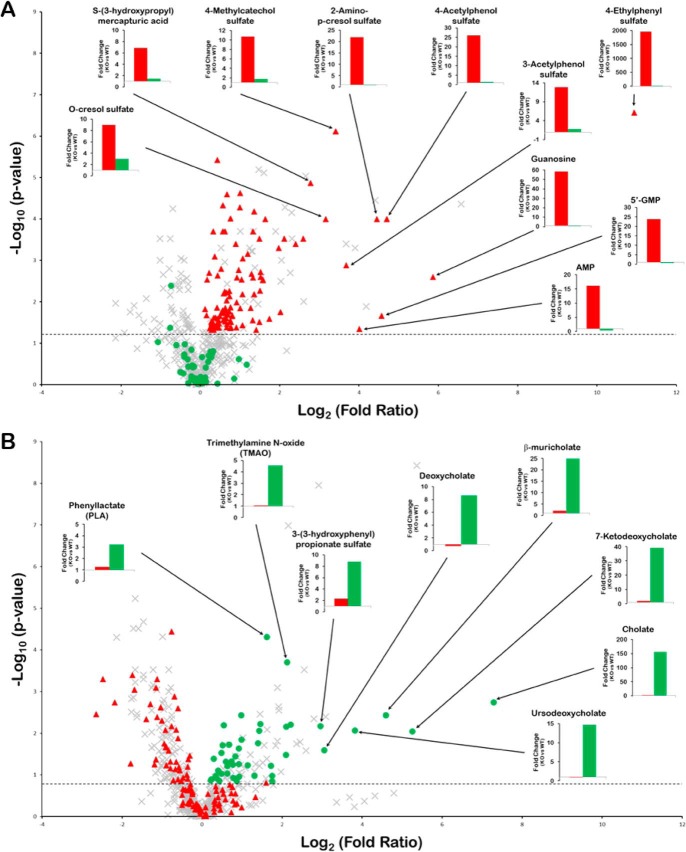
Figure 2.
Unique metabolites for the Oat1KO and Oat3KO. Volcano plots displaying metabolomics data derived from the analysis of the serum obtained from Oat1KO (KO versus WT) (A) and Oat3KO (KO versus WT) (B). The negative logarithm of the p value for each metabolite is plotted against the logarithm to the base 2 of the fold-change (KO versus WT). Each point in the plot represents a metabolite; the red triangles indicate those metabolites accumulating in the serum of the Oat1KO (p ≤0.05; dotted horizontal line), but not the Oat3KO; the green circles indicate metabolites accumulating in the Oat3KO (generally p ≤0.1 (dotted horizontal line) and see under “Experimental procedures”), but not the Oat1KO; the gray crosses indicate those metabolites either unchanged or that show similar changes in both knockout animals. The bar graphs in each volcano plot show the fold-change for the indicated metabolites in either the Oat1KO (red bars) or Oat3KO (green bars).

