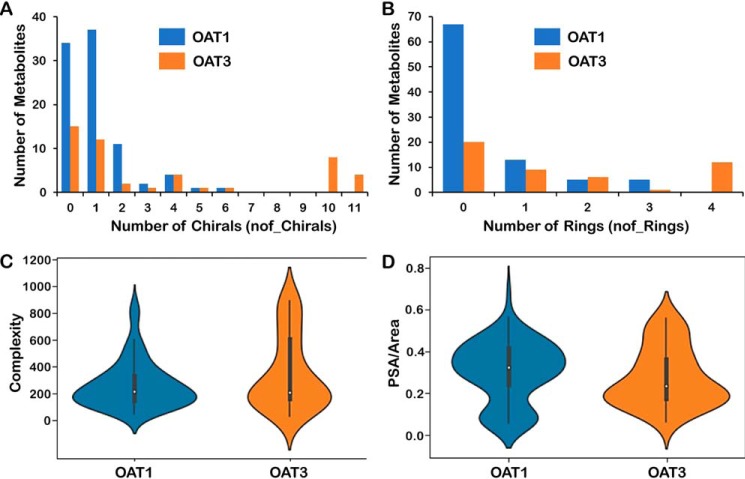
Figure 3.
Comparison of unique Oat1 and unique Oat3 molecular properties. A, distribution plot of a number of chirals (OAT1, blue; OAT3, red). B, distribution plot of a number of rings (OAT1, blue; OAT3, red). C, violin plot of complexity. D, violin plot of polar surface area over molecular area. From these plots, one can see that OAT1-unique metabolites are generally smaller molecules with less complexity and fewer chiral centers and less ringed structures, whereas the OAT3-unique metabolites generally are larger and more complex molecules with more chiral centers and more ringed structures. See Table S1 for the full list of metabolites and Table S2 for the full list of molecular properties.

