Figure 4.
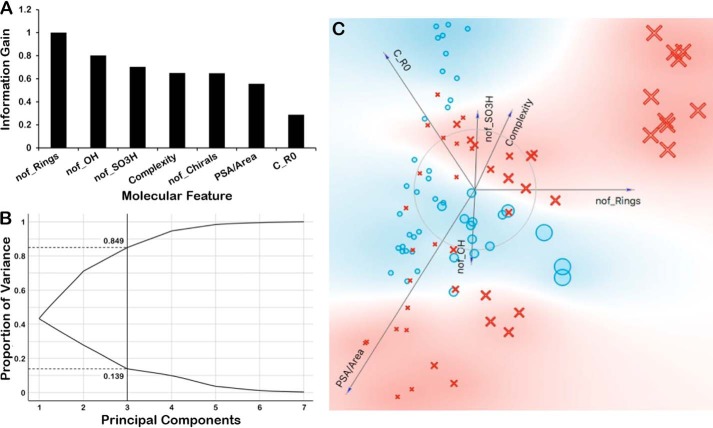
Ranking of molecular properties according to information gain and other metrics indicate their likely high importance. A, bar graph of the ranking of molecular properties according to information gain in order to tease out importance of some molecular properties. The information gain for each molecular feature was normalized to the feature displaying the greatest gain (nof_Rings). B, principal component analysis reveals that first three components account for ∼90% of the variance. C, FreeViz visualization of various molecular properties and their importance in separating out OAT1 versus OAT3. In the FreeViz graphical representation, the magnitude of each vector indicates the relative importance of each molecular feature as determined by the FreeViz algorithm, whereas the direction of each vector indicates the relative preference of that feature for OAT1 (blue background) or OAT3 (red background). In the representation, the blue circles depict the OAT1-unique metabolites, and the red crosses depict the OAT3-unique metabolites. The size of each symbol corresponds to the number of rings. For example, the large red crosses in the upper right-hand portion of the representation are OAT3-unique metabolites that have a large number of rings.

