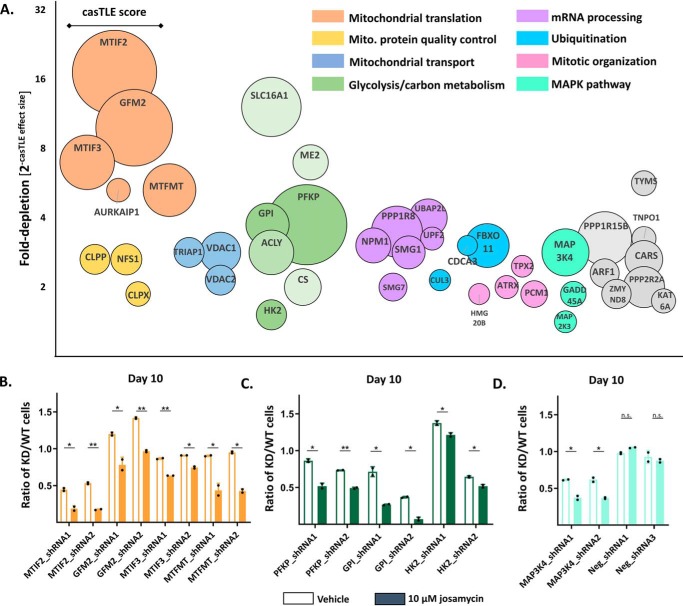
Figure 2.
Results of the shRNA screen for genes that sensitize cells to josamycin. A, the top 40 sensitizing hits from the batch shRNA screen. Circle size is proportional to the casTLE score, a measure of statistical confidence in each gene. The y axis is 2(−casTLE effect size), which describes the normalized -fold depletion of a specific gene in the treated population. The x axis does not represent any quantitative feature. B, individual shRNA validations of the mitochondrial translation hits MTIF2, GFM2, MTIF3, and MTFMT using a competitive growth assay. The ratio of KD/WT cells is the proportion of knockdown to WT K562 cells after 10 days of coculture initiated at a 1:1 ratio in an untreated (unshaded columns) versus a 10 μm josamycin–treated population (shaded columns). C, individual shRNA validation of the glycolysis hits Gpi, Pfkp, and Hk2 using a competitive growth assay. D, individual shRNA validation of Map3k4 and nontargeting shRNAs using a competitive growth assay. In B–D, error bars indicate mean ± S.D., n = 2, and dots represent individual values. Differences in the KD/WT ratio between DMSO- and drug-treated cells are indicated: *, p < 0.05; **, p < 0.01; n.s., p > 0.05, calculated as detailed under “Experimental procedures.”

