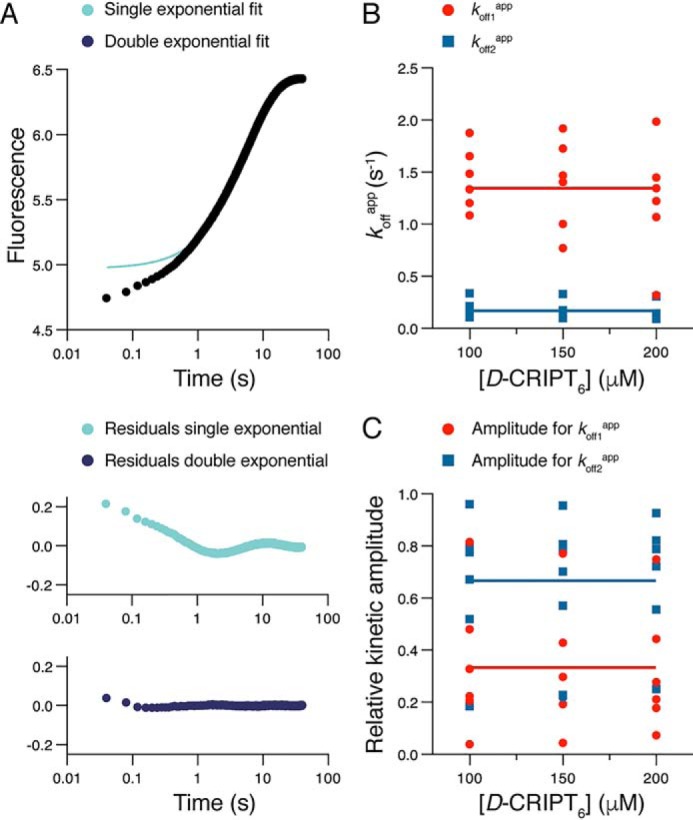
Figure 3.

Dissociation kinetics of the PSG supramodule and D-CRIPT6. A, example of kinetic trace from an experiment where a complex of PSG and D-CRIPT6 (2 and 10 μm) was rapidly mixed with an excess of unlabeled CRIPT (150 μm). The resulting trace was fitted to a single or double exponential, and the residuals from the respective fit are presented below the trace. The double-exponential fit yielded the following parameters: koff1app = 1.35 s−1 (amplitude = 0.32) and koff2app = 0.16 s−1 (amplitude = 1.4). B and C, this experiment was repeated six times, each time at three different concentrations of unlabeled CRIPT (100, 150, and 200 μm). The double-exponential fit yielded koffapp values (B) and their associated amplitudes (C, normalized), which were plotted versus CRIPT concentration. The large scatter in the points, in particular for the amplitudes, reflects the covariation of parameters in the curve fitting. The average of all 18 koffapp values for each kinetic phase yielded the following parameters: koff1app = 1.35 ± 0.42 s−1 and koff2app = 0.17 ± 0.08 s−1 (indicated by horizontal lines in B). The average of all 18 amplitudes yielded the following values: Amp1 = 0.33 ± 0.24 and Amp2 = 0.67 ± 0.24 (indicated by horizontal lines in C).
