Figure 6.
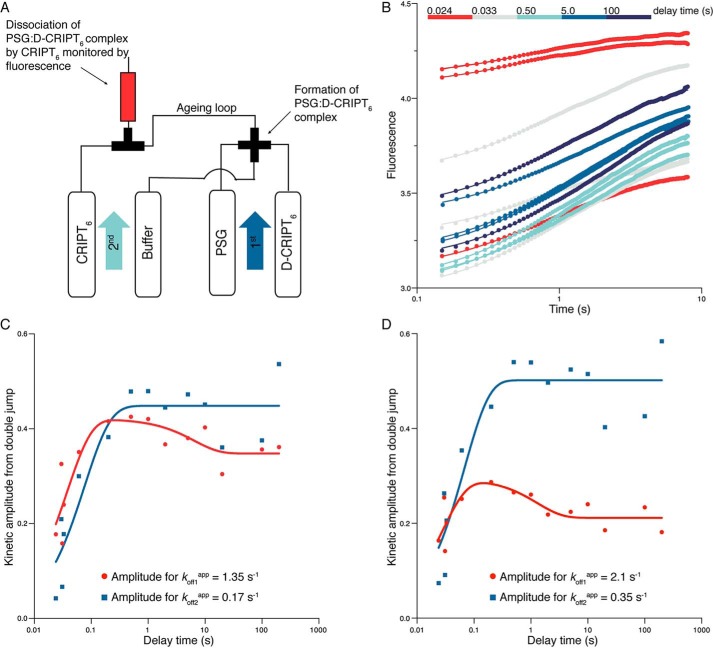
Interrupted binding experiments. A, schematic of the double-jump setup. In the first jump, 4 μm PSG was mixed with 8 μm D-CRIPT6 (i.e. the final concentrations after mixing were 2 μm and 4 μm, respectively) and incubated for a certain delay time in an aging loop. Following the set delay time, any formed complex was dissociated by a large excess of unlabeled CRIPT in a second jump (final concentrations were 1 μm PSG, 2 μm D-CRIPT6, and 50 μm unlabeled CRIPT). B, the dissociation kinetics were monitored in the flow cell. The kinetic traces were fitted simultaneously to a double-exponential function with either locked kobs values (the two average koffapp values from single-jump experiments, 1.35 s−1 and 0.17 s−1, respectively) or shared and free-fitted kobs values (koff1app = 2.1 s−1 and koff2app = 0.35 s−1). The best fit curves in the figure correspond to the latter fit. C and D, the kinetic amplitudes from the respective fits in B were plotted against delay time. This reflects the build up of PSGA:D-CRIPT6 and PSGB:D-CRIPT6, respectively, with time. These amplitude data, in turn, were fitted to a double-exponential function to obtain two “observed double-jump rate constants” for the build up of PSGA and PSGB, respectively. From the fit, kobsDJ values of around 20–40 s−1 and 0.1–0.8 s−1, respectively, were obtained. Although the parameters are underdetermined, it is clear that there is an initial increase in the respective population, followed by a decrease in PSGA:D-CRIPT6. The expected concomitant increase in PSGB:D-CRIPT6 is lost in the experimental noise.

