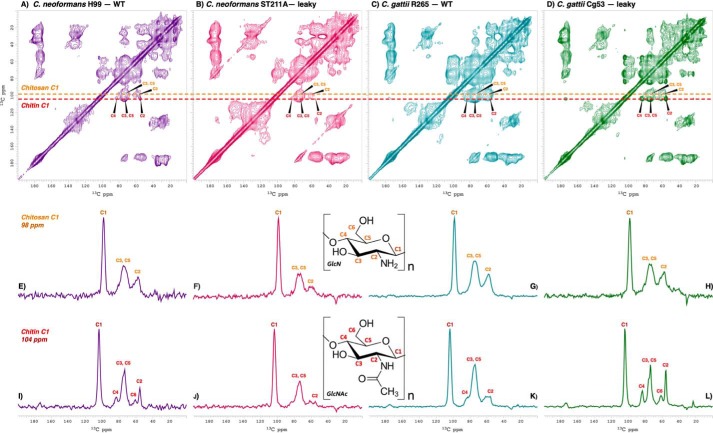
Figure 7.
Cell-wall chitin flexibility is augmented in C. neoformans and C. gattii leaky mutant strain melanin ghosts. Top row, 2D 13C-13C DARR spectra (50-ms mixing time) of melanin ghosts generated from cell cultures containing d-[U-13C6]glucose as the sole carbon source. Cross-peaks represent proximal carbon pairs separated by distances corresponding to ∼1 bond length. Middle row, 98-ppm cross-sections displaying chitosan C1 correlations. Bottom row, 104-ppm cross-sections displaying chitin C1 correlations. A, E, and I, C. neoformans H99 (WT). B, F, and J, C. neoformans ST211A (leaky). C, G, and K, C. gattii R265 (WT). D, H, and L, C. gattii Cg53 (leaky). The vertical scale of the 2D spectra was adjusted such that all significant cross-peaks are visible, and the same numbers of contours are displayed for the carbonyl resonance at 173 ppm. The 1D cross-sections were adjusted by setting the largest peak to full scale.

