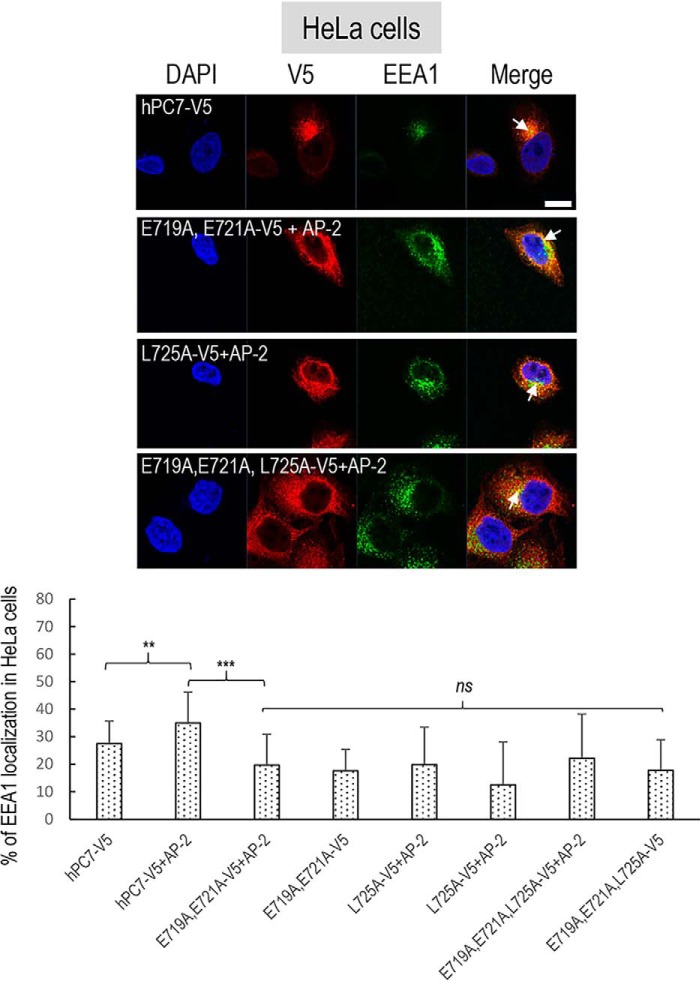
Figure 11.
Overexpression of AP and localization of human PC7 CT mutants with early endosomes. Top panel, immunofluorescence of hPC7 or its CT mutants (red labeling) in the presence of AP-2 protein on permeabilized HeLa cells. The early endosomal marker (EEA1) is labeled in green. Cell nuclei are marked by DAPI (blue labeling). Quantifications were performed using IMARIS software. Co-localization of EEA1 with WT hPC7, E719A,E721A mutant (2nd panel), L725A mutant (3rd panel), E719A,E721A,L725A (4th panel) mutant upon overexpression of AP-2μ. These results are representative of a minimum of three independent experiments, and quantification represents an average of n = 15 cells. Error bars indicate averaged values ± S.D. Bottom panel: **, p < 0.01, ***, p < 0.001, ns, not significant (Student's t test). Bar = 1 μm.

