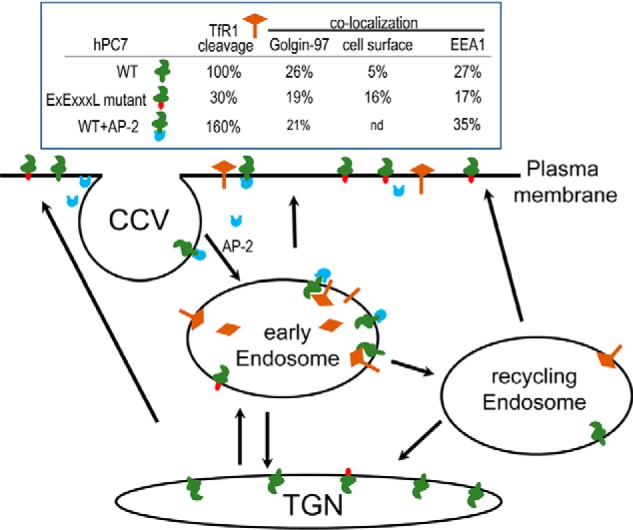
Figure 13.

Schematic representation of PC7 trafficking and cleavage activity. The table summarizes the cleavage activity and trafficking of hPC7 and its mutants to the TGN (Golgin-97), cell surface, and early endosomes (EEA1). Activity cleavage results are semi-quantitative and normalized to the WT hPC7 (100%). The cartoon summarizes the localization and cleavage activity of PC7 WT (green CT) and its EXEXXXL mutant (red CT) and the regulation of hPC7 in the presence of AP-2 (blue). CCV, clathrin-coated vesicles; nd, not determined.
