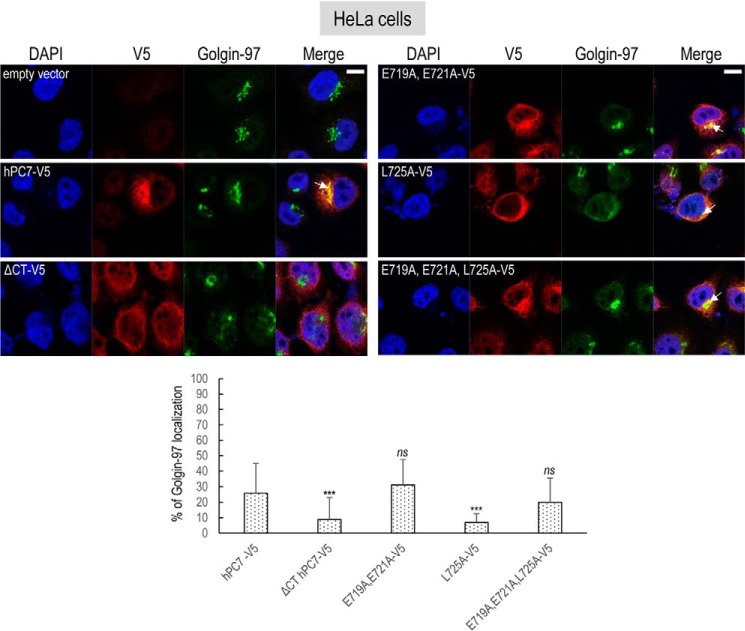
Figure 6.
Localization of human PC7 and its CT mutants with trans-Golgi network. Immunofluorescence of hPC7 or its CT mutants (red labeling) on permeabilized HeLa cells. Cell compartments Golgin-97 marker are labeled in green. Cell nuclei are marked by DAPI (blue labeling). Quantification of co-localization between hPC7 and its mutants with Golgin-97 using IMARIS software. These results are representative of a minimum of three independent experiments, and quantification represents an average of n = 15 cells. Error bars indicate averaged values ± S.D. ***, p < 0.001; ns, not significant (Student's t test). Bar = 1 μm.

