Figure 1.
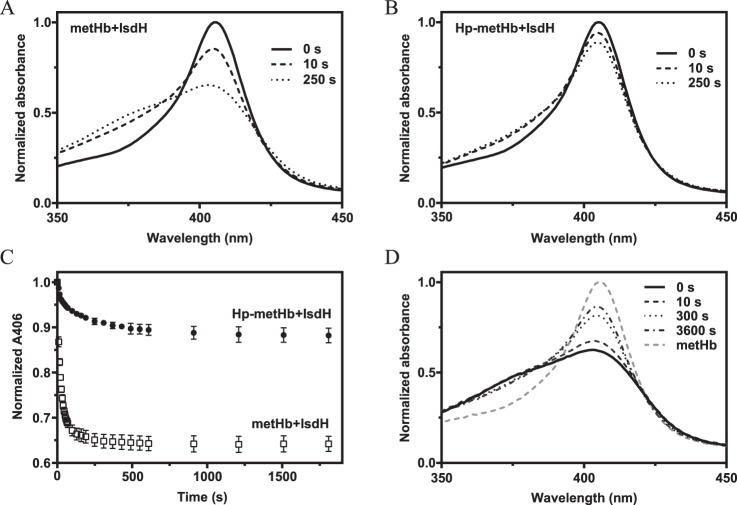
Heme transfer from metHb and Hp–metHb to IsdHN2-N3. A and B, spectral changes over time for metHb+IsdHN2-N3 (A) and Hp–metHb+IsdHN2-N3 (B). C, absorbances at 406 nm for metHb + IsdHN2-N3 and Hp–metHb + IsdhN2-N3 followed for 30 min. Normalized absorbances at 406 nm are represented as mean values ± S.D. (n = 3). D, spectral changes over time for metHb preincubated with IsdHN2-N3. Hp was added at time point 0. After 1 h, no further spectral change was observed indicating that the system reached equilibrium.

