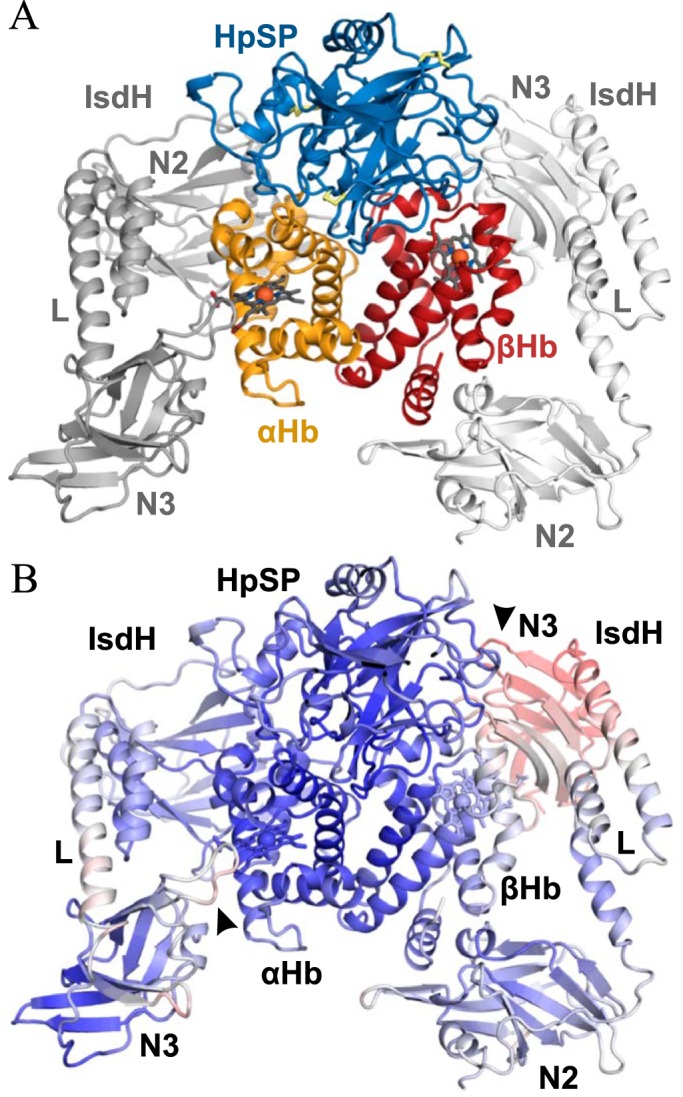
Figure 3.

Structure of the HpSP–αβHb–IsdHN2-N3 complex. A, Cartoon representation of the 2.9 Å resolution crystal structure of HpSP–αβHb–IsdHN2-N3 complex. Hp is shown in blue, αHb is in orange, βHb is in red, and IsdHN2-N3 is light and dark gray. N2 and N3 denotes IsdHN2 and IsdHN3, respectively. L denotes the IsdHlinker domain. Heme groups are represented by dark gray sticks, and iron atoms are represented by red spheres. Disulfides are shown as yellow sticks. B, B-factors of the determined structure of Hp–Hb–IsdHN2-N3 are plotted on a cartoon representation of the structure with blue representing low B-factor, white representing intermediate, and red representing high. The interfaces αHb–IsdHN3 and βHb-IsdhN3 are marked with arrows.
