
FIG 4.
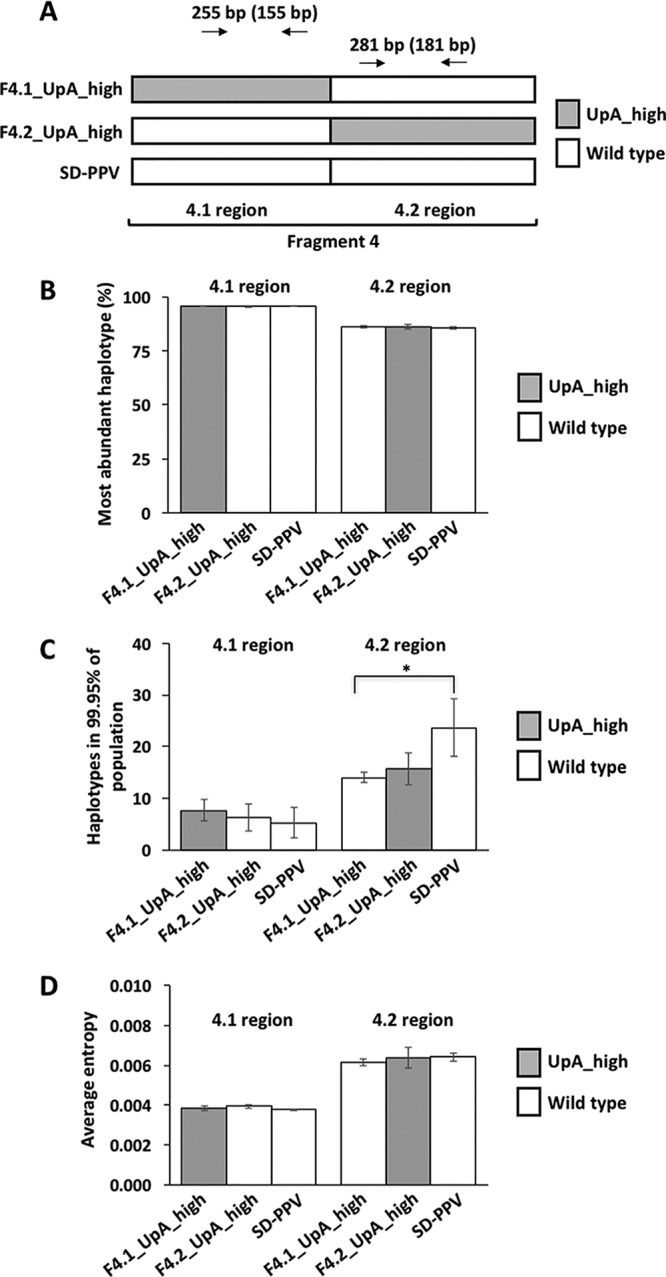
Genome stability of attenuated SD-PPV with high UpA content. (A) Schematic representation of the viral segment F4 (divided into F4.1 and F4.2) from the parental SD-PPV and those viral derivatives used for this experiment. Virus genotypes in F4 (based on UpA content) are indicated with white or gray boxes. The two regions from which RT-PCR products were obtained, and the size of these amplicons, are also indicated. The sizes of amplicons after quality trimming are indicated in parentheses. (B) Bar plots representing the percentage of the most abundant viral haplotype in upper noninoculated leaves of plants infected with the indicated viruses. (C) Bar plots representing the numbers of different viral haplotypes in 99.95% of the viral population in upper noninoculated leaves of plants infected with the indicated viruses. Asterisks indicate significant differences (P value < 0.05, t test). (D) Bar plots representing the overall entropy of the region under study when considering every position after the trimming of sequenced amplicons (155 for 4.1 region and 181 for 4.2 region). All bars represent the mean ± SD of results for three infected plants (n = 3), and they are depicted in white or gray based on the genotype of the corresponding viruses in the indicated regions.