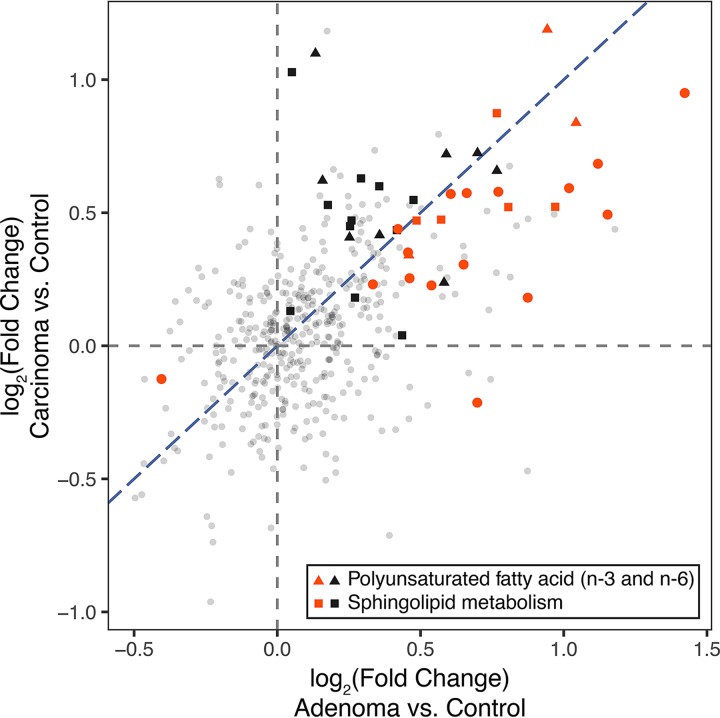
FIG 2.
Fold changes in metabolite abundances for the adenoma and carcinoma groups in comparison to the control group. Fold changes for adenoma versus control and carcinoma versus control are shown on x and y axes, respectively. Metabolites that were differentially abundant in the adenoma group in comparison to the control group are highlighted in red. Triangles and squares regardless of color represent metabolites belonging to two subpathways, “polyunsaturated fatty acid (n-3 and n-6)” and “sphingolipid metabolism,” respectively. All other metabolites are shown as small gray circles. Blue diagonal dashed line represents the line y = x.

