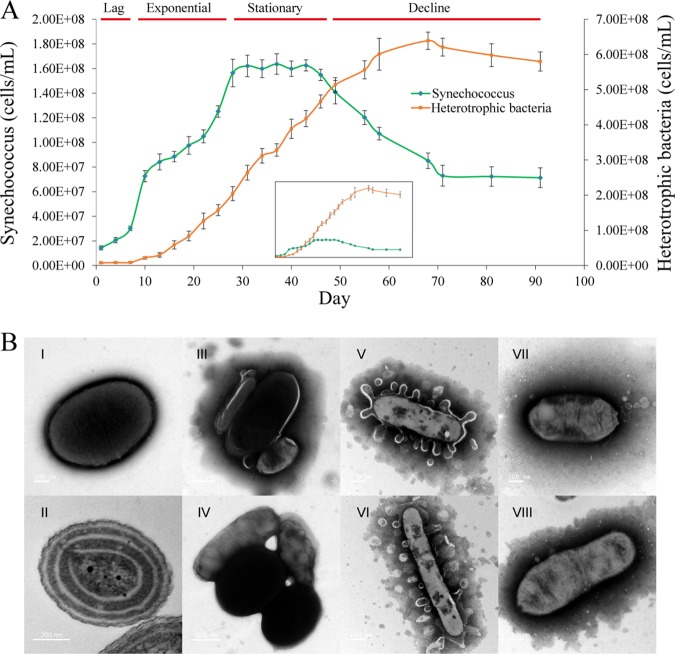
FIG 1.
Abundance dynamics (A) and morphology (B) of Synechococcus and associated heterotrophic bacteria in the Synechococcus sp. strain YX04-3 coculture. The green curve represents Synechococcus cell abundances (left vertical axis) over time, while the orange curve shows heterotrophic bacterial cell abundances (right vertical axis) over time. The inset figure shows the dynamics among Synechococcus and heterotrophic bacterial abundances on the same vertical axis scale. Time (in days) is shown on the x axis. Error bars represent the ranges of values from triplicate measurements. The morphology of Synechococcus (I and II), attached cells or aggregates (III and IV), and associated heterotrophic bacteria (V to VIII) in the coculture system are depicted. Image scales are shown in the lower-left corner of the micrographs.

