FIG 4.
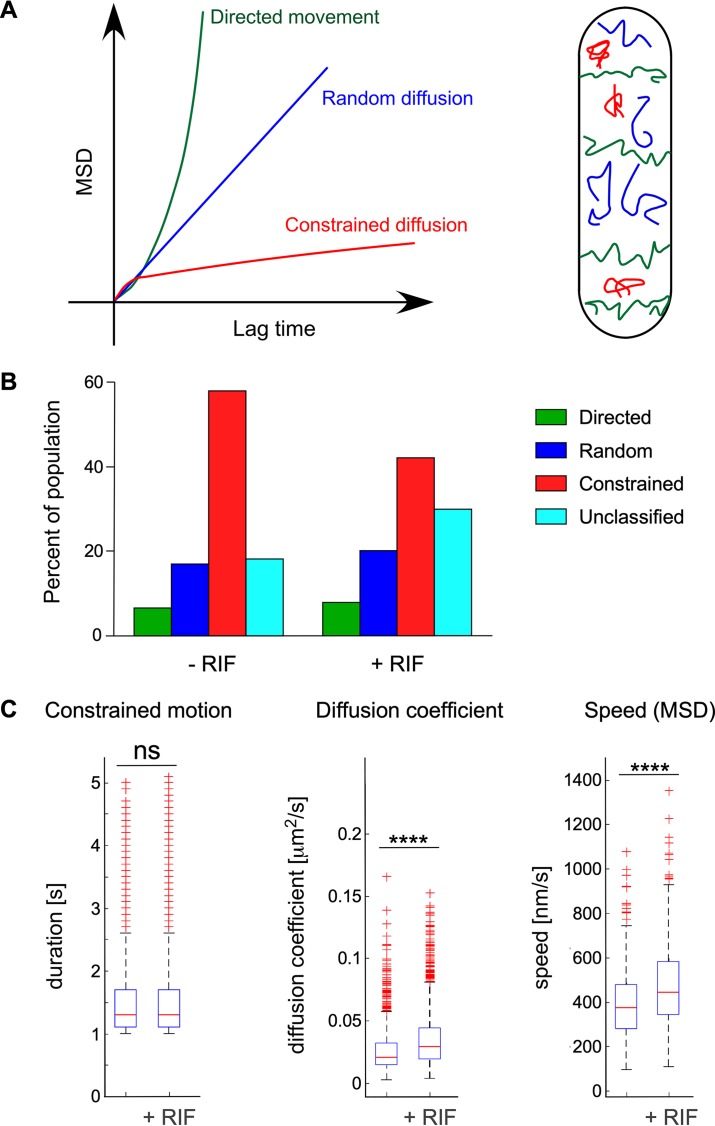
RNase Y focus dynamic behavior and effect of transcription arrest. Strain SSB2048, expressing an RNase Y-sfGFP fusion protein, was grown in SMS medium and analyzed at mid-exponential phase. RNase Y focus motion was categorized based on MSD curve characteristics (as described in the legend for Fig. S6) (45). (A) MSD curves characteristic of directed movement [green curve, MSD(t)= (vt)2], random diffusion [blue curve, MSD(t)= 4Dt], and constrained diffusion (red curve, MSD reaches a plateau). On the right is a depiction of a rod-shaped cell illustrating the three modes of movement of 2D-SPT trajectories of RNase Y assemblies. (B) Percentage of RNase Y foci that can be categorized into one of the three motion profiles or, if not applicable, into an unclassified population (light blue). Transcription arrest was induced in strain SSB2048 (rny-sfgfp) by addition of rifampin to mid-log cells for 30 min. Color code for different types of motion is the same throughout the figure. RNase Y motion was analyzed under normal growth conditions and following transcription arrest (+Rifampin) as described in Materials and Methods. (C) Effect of transcription arrest on the kinetic parameters of RNase Y motion patterns. RNase Y movements were recorded by TIRFm of strain SSB2048 (expressing RNase Y-sfGFP) and categorized after fitting of MSD curves. Strains were analyzed under normal growth conditions and 30 s after transcription arrest. Constrained motion foci were characterized by the time (seconds) of confinement at the same position before measurable movement set in. For randomly diffusing assemblies, a linear fit model was used to calculate the diffusion coefficient (square micrometers per second). For foci belonging to the directed movement category, the average speed was calculated by a second-order polynomial fit. The blue boxes represent the interquartile range (25th to 75th percentiles), the red line in the box indicates the 50th percentile (median), and the black dotted bars represent the range of results, excluding outliers. The red plus signs are outliers. ns, not significant; ****, P < 0.0001.

